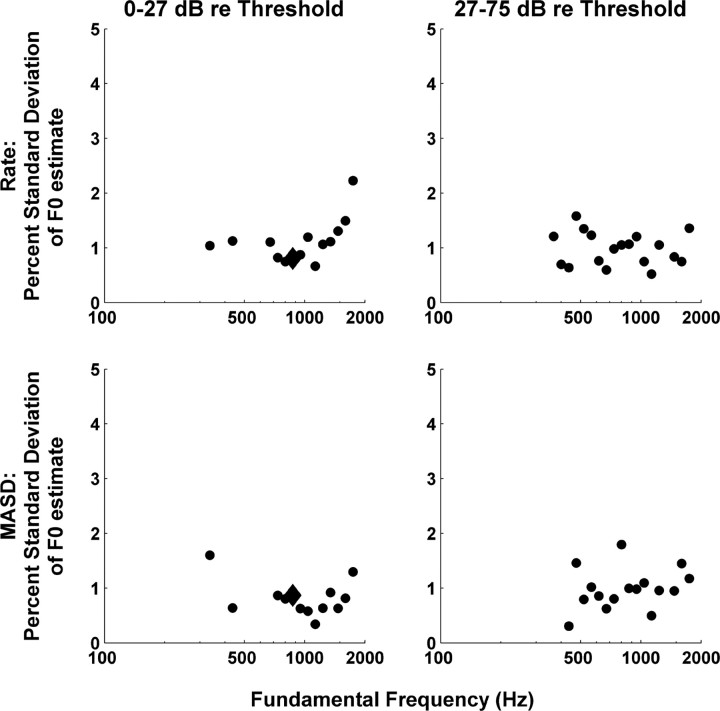
Figure 11.
SD of the F0 estimated from tonotopic profiles of interpolated rate (top) and MASD (bottom) as a function of stimulus F0 for two ranges of stimulus levels. SDs are expressed as a percentage of the actual F0 and were computed by fitting Equation 1 to the rate and MASD profiles (as in Fig. 5B) and using the Jacobian of the best-fitting parameter vector.

