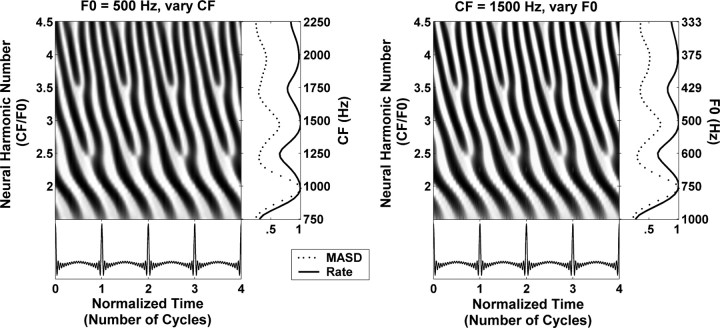
Figure 2.
Illustration of the principle of cochlear scaling invariance using the peripheral auditory model for cat of Zhang et al. (2001). Left, Spatiotemporal response pattern of the model AN for CFs between 750 and 2250 Hz to a harmonic complex tone with an F0 of 500 Hz at 40 dB SPL. The response is displayed as a function of time (in normalized units t × F0) and cochlear place expressed as neural harmonic number (CF/F0). Right, Temporal response pattern of one model AN fiber (CF, 1500 Hz) to a series of harmonic complex tones with F0 values varying from 333 to 1000 Hz. The response is shown in the same dimensionless coordinates as in the left. The rightmost panels show the spatial profiles of average discharge rate (solid lines) and mean absolute spatial derivative (dashed) derived from the response patterns at their immediate left. Rate and MASD profiles are normalized by their maximum.

