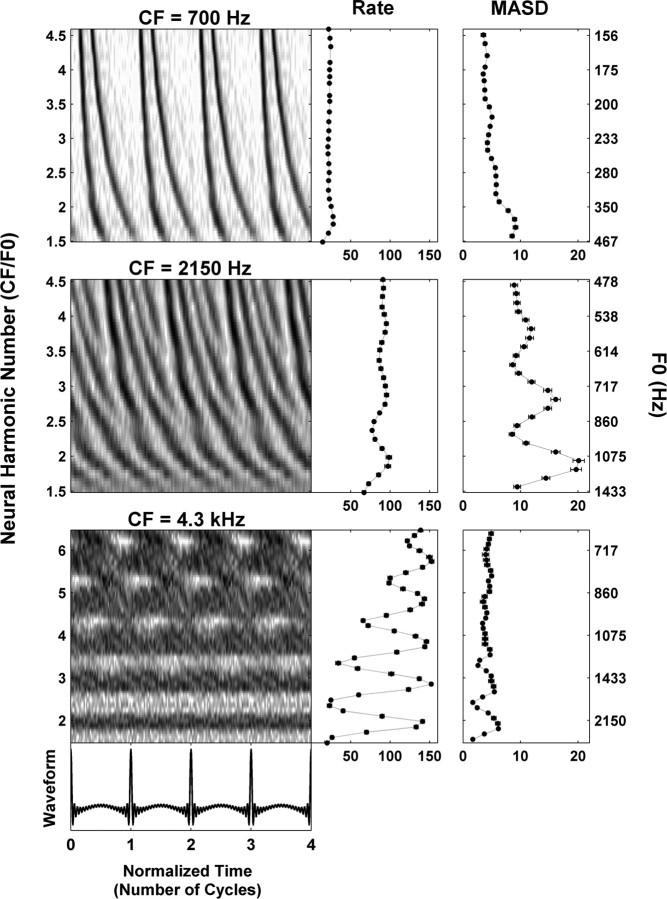
Figure 3.
Responses of three AN fibers with CFs of 700 Hz (top), 2150 Hz (middle), and 4300 Hz (bottom) to series of harmonic complex tones in cosine phase. Left panels, Pseudo-spatiotemporal discharge pattern, displayed as a function of normalized time (horizontal axis) and neural harmonic number CF/F0 (vertical axis). Right panels, Firing rate and MASD derived from the corresponding pseudo-spatiotemporal response patterns on the left.

