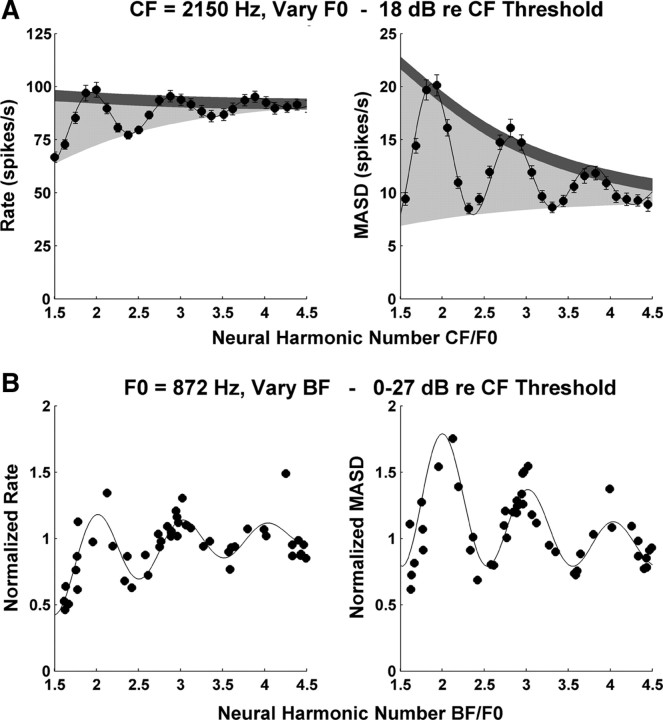
Figure 5.
A, Profiles of average rate (left) and MASD (right) against neural harmonic number for an AN fiber (CF, 2150 Hz; same fiber as in middle panel of Fig. 3) in response to a series of harmonic complex tones at 18 dB re. thresholds. The filled circles show the data points, and the solid lines show best-fitting curves based on Equation 1. The light shadings indicate the area between the top and bottom envelopes of the fitted curve. The dark shadings correspond to two typical SDs of the data points, estimated by bootstrap (see Materials and Methods). The ratio of these two quantities is used as an estimate of the strength of the pitch cues provided by each neural representation. B, Interpolation method used for replotting rate and MASD as a function of BF across the AN fiber population for a specific stimulus F0 (872 Hz). Each symbol shows the normalized, interpolated rate (left) or MASD (right) at F0 = 872 Hz for one AN fiber. The solid lines show the best-fitting curves based on Equation 1. The BF estimated from responses to harmonic complex tones is expressed in dimensionless units (BF/F0). Harmonics are in cosine phase.

