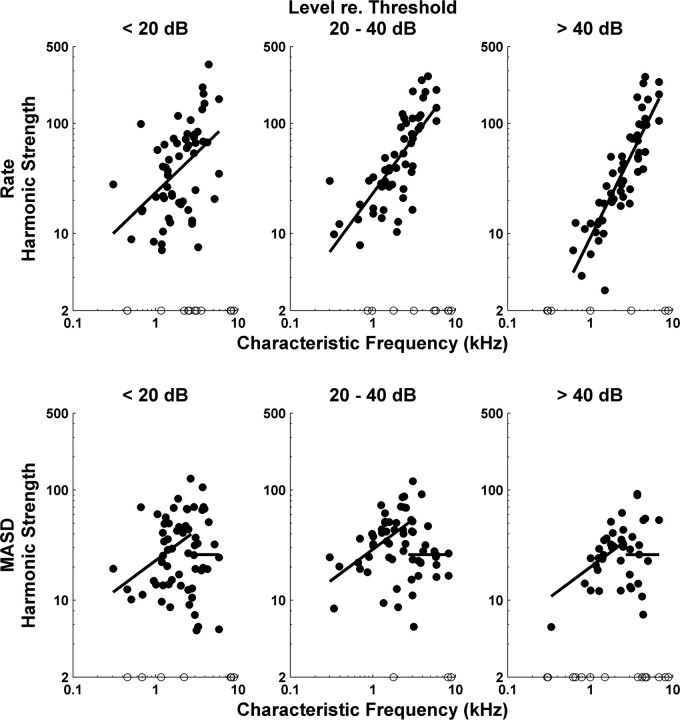
Figure 6.
Strength of rate–place and spatiotemporal cues to resolved harmonics as a function of CF for the entire set of responses to complex-tone series with harmonics in cosine phase. The filled circles show harmonic strengths computed from best-fitting curves to profiles of firing rate (top) and MASD (bottom) against neural harmonic number. The open circles along the horizontal axis show data points for which the best-fitting curve had no reliable oscillatory component. Results are grouped by level relative to the threshold of each fiber for a pure tone at CF. The solid lines show best-fitting lines across all level groups obtained from analyses of covariance. Separate analyses were performed for rate and MASD, and, for MASD, for CFs below and above 2700 Hz, respectively.

