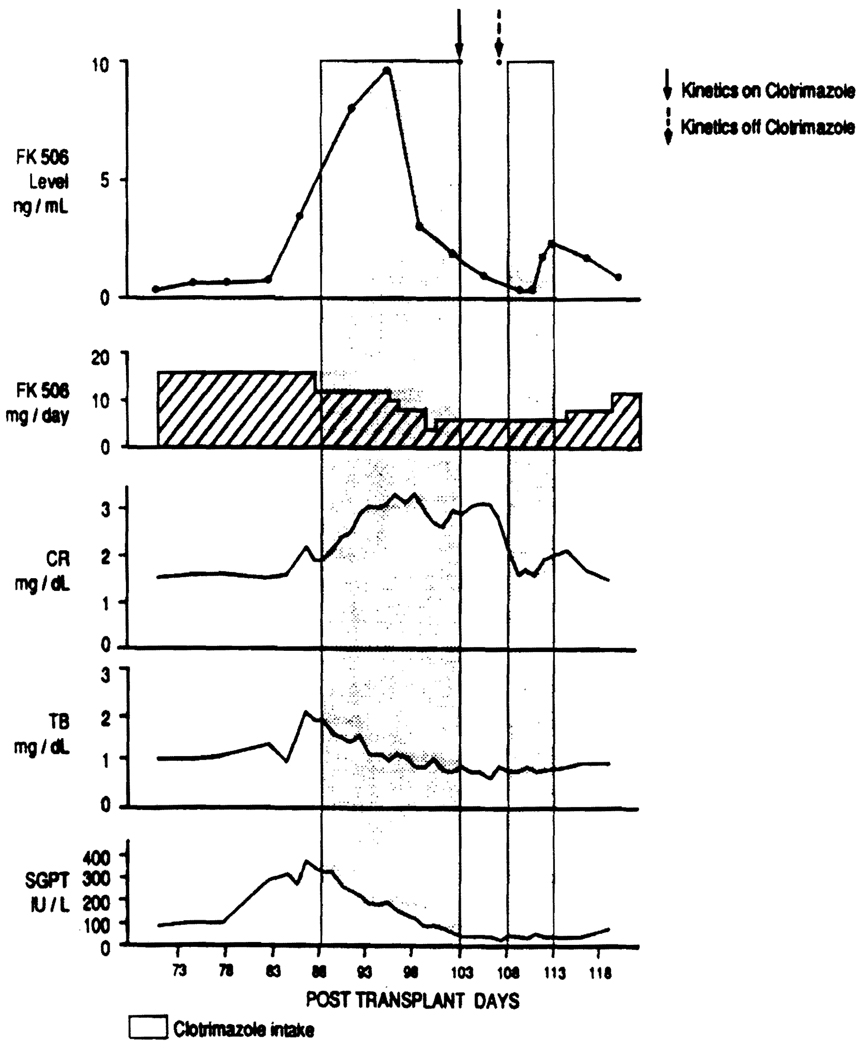
FIGURE 1.
Patient’s serial biochemistries, trough FK506 plasma concentrations and FK506 dose, from posttransplant day 73 to posttransplant day 118. The shadowed areas correspond to the period of time during which the patient received Clotrimazole therapy, and the arrows indicate the dates during which the pharmacokinetics studies were performed.

