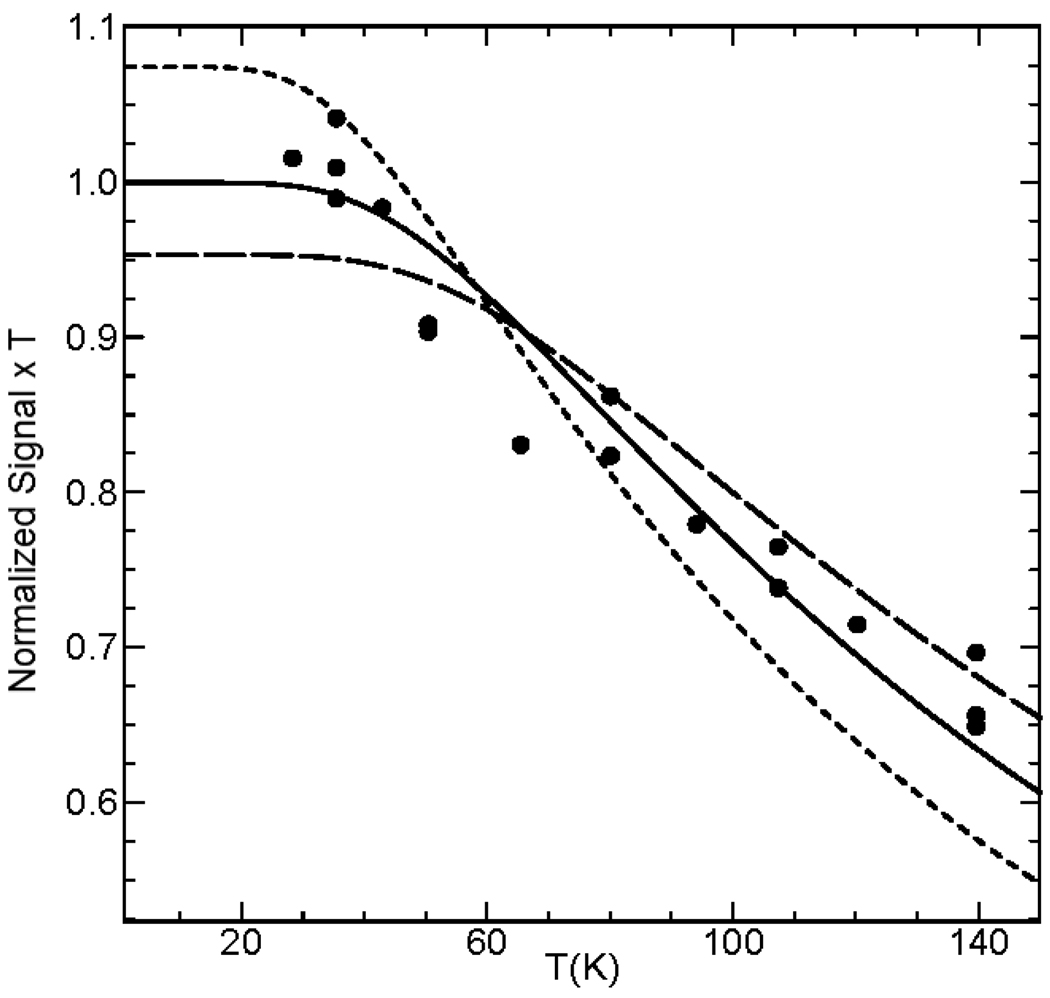
Figure 11.
Temperature dependence of the population of the S = ½ ground state of 1-OH in 3:1 CH2Cl2/MeCN. The solid line is a fit for J = 90 cm−1. The dashed curves were calculated for J = 70 and 110 cm−1. Double and triple entries compare results obtained for repeats on different days. Results for 1-F are shown in Fig. S2 in Supporting Information.

