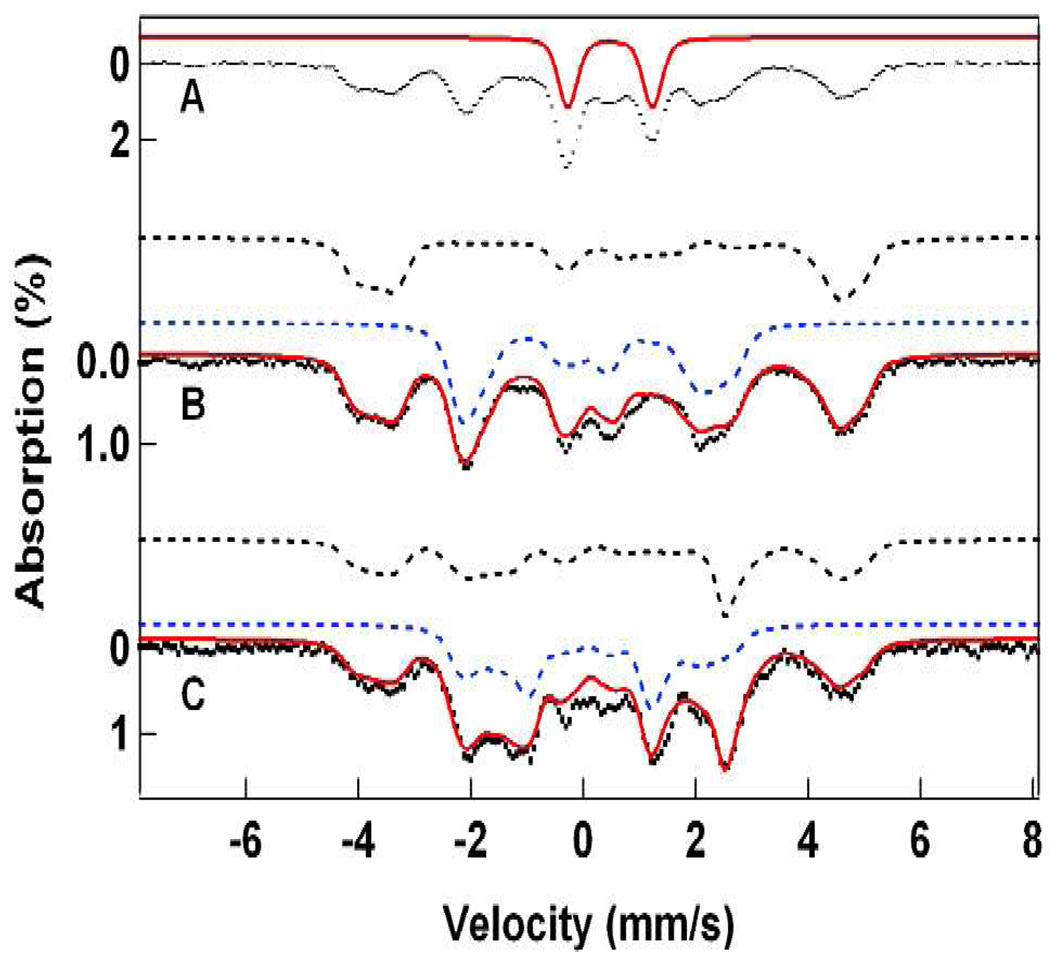
Figure 4.
Mössbauer spectra of 1-F in 3:1 PrCN/MeCN recorded at 4.2 K in 50 mT fields applied parallel (A, B) and perpendicular (C) to the observed γ rays. The red line in (A) outlines the contribution of a diferric species (22% of Fe; a decay product). The spectra in (B) and (C) were obtained by removing the diferric species from the raw data. The solid red lines in (B) and (C) are spectral simulations for 1-F based on eq 1 using the parameters listed in Table 1. The dashed lines drawn above the data show the contributions of the FeIII (black) and FeIV (blue) sites.

