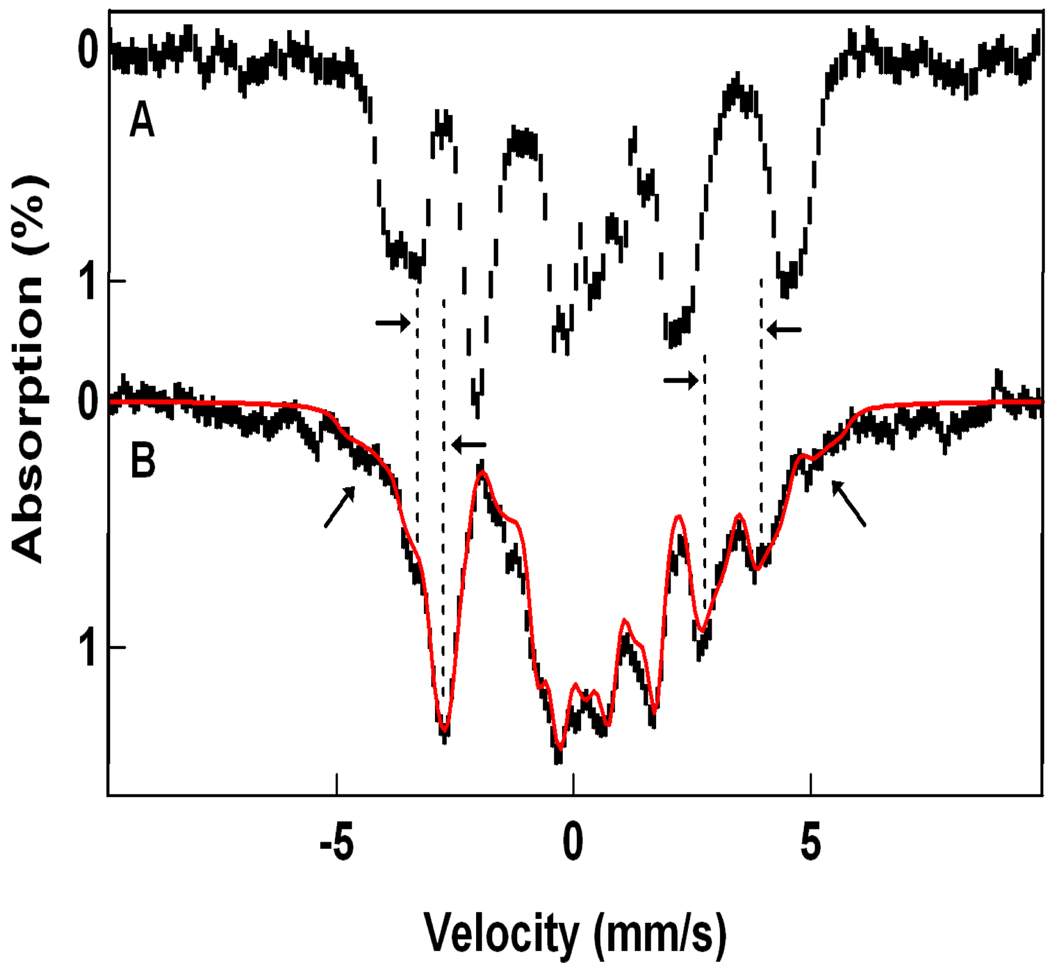
Figure 5.
4.2 K Mössbauer spectra of 1-F recorded in a parallel field of 50 mT (A) and 4.0 T (B). The spectrum shown in (A) is the low field spectrum of Figure 4B. The horizontal arrows indicate the movement of the absorption lines with increasing applied field. Outward moving lines belong to the FeIV site. The slanted arrows in (B) mark shoulders belonging to the absorption of the FeIII site in Ms = + ½ state of the ground doublet. The red solid line is a spectral simulation with eq 1 using the parameters of Table 1.

