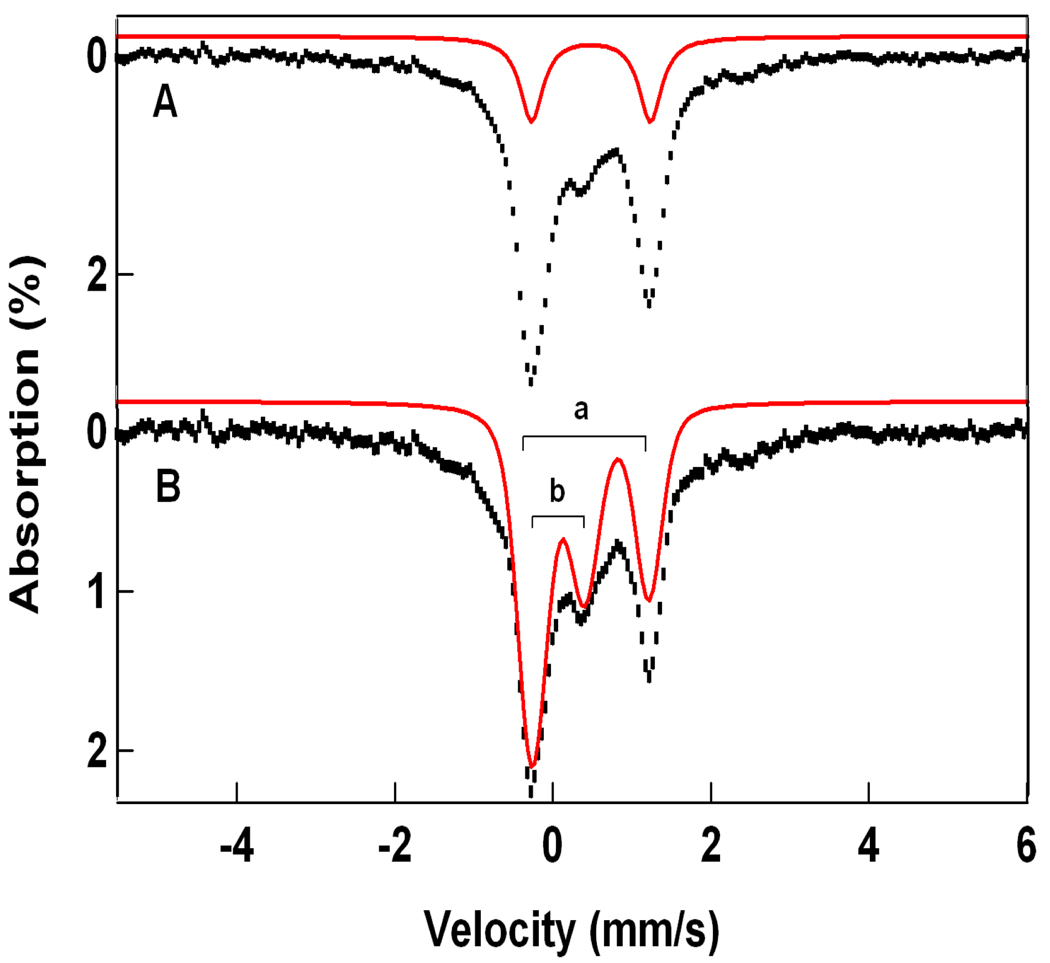
Figure 6.
Mössbauer spectrum (A) of 1-F recorded at 100 K in a parallel field of 50 mT. The red line in (A) indicates the contribution of a 22% diferric contaminant (same as in Figure 4A). Subtraction of this contaminant yields the spectrum (hashed) of 1-F, shown in (B). The solid line in (B) is the superposition of a doublet representing the FeIII site (doublet a) with a doublet (b) belonging to the FeIV site of 1-F. The broad wings indicate that the electronic system has not yet attained the fast fluctuation limit.

