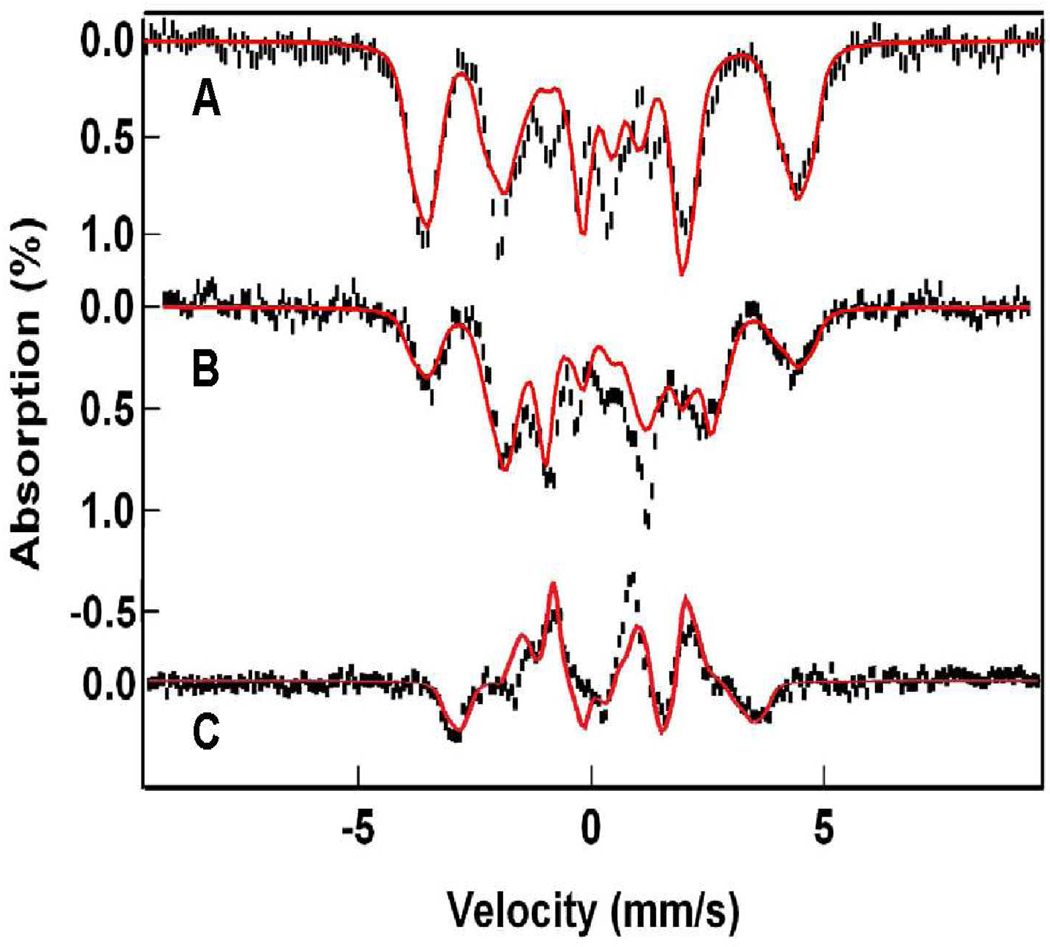
Figure 8.
4.2 K Mössbauer spectra of 1-OH analyzed with eq 4. Spectra in (A) and (B) are the same as in Figure 7. Spectrum in (C) is a difference spectrum obtained by forming the difference spectrum “parallel minus transverse.” In the difference spectrum, the contributions of the two FeIII contaminants cancel. Solid lines are spectral simulations using the parameters listed in Table 2.

