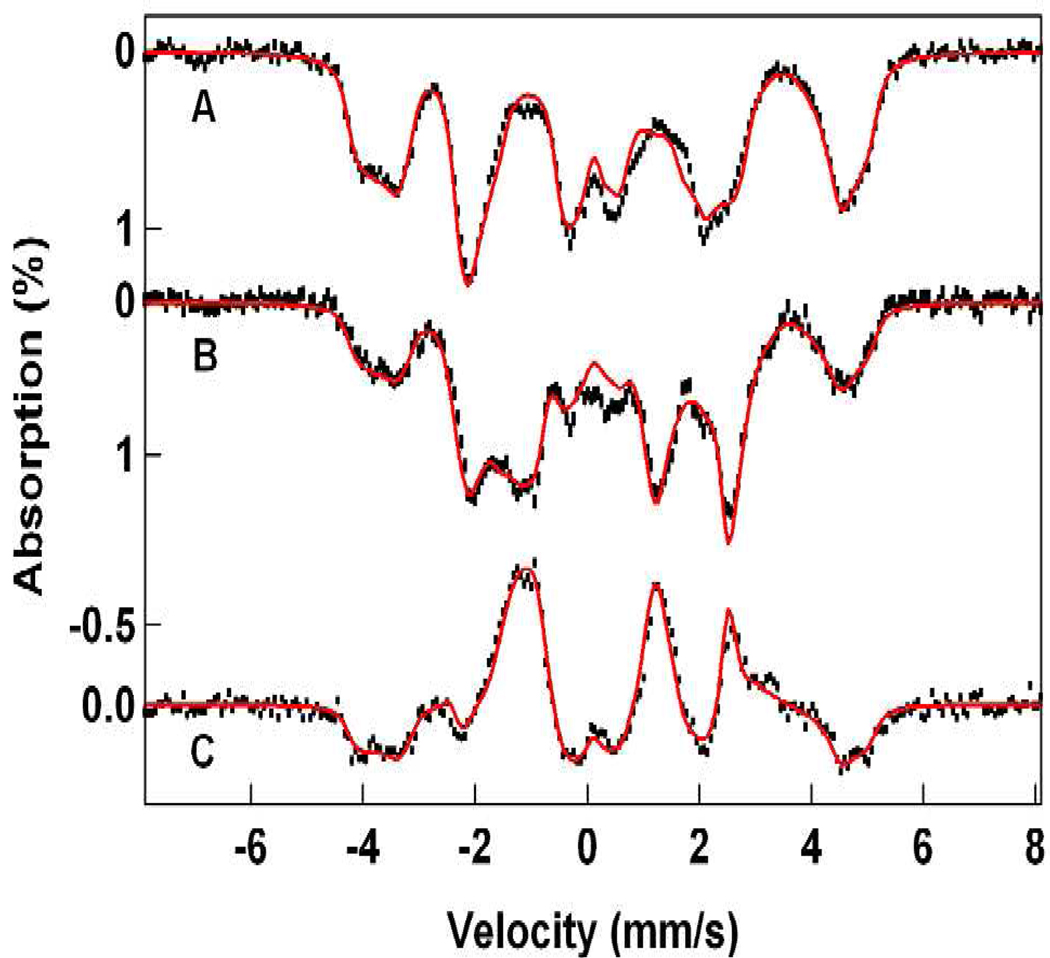
Figure 9.
4.2 K Mössbauer spectra of 1-F analyzed with eq 4. Spectra in (A) and (B) are the same as in Figure 4. Spectrum (C) is a difference spectrum “parallel minus transverse field” using the data of Figure 5A and its transverse field counterpart. Red solid lines are spectral simulations using the parameters listed in Table 2.

