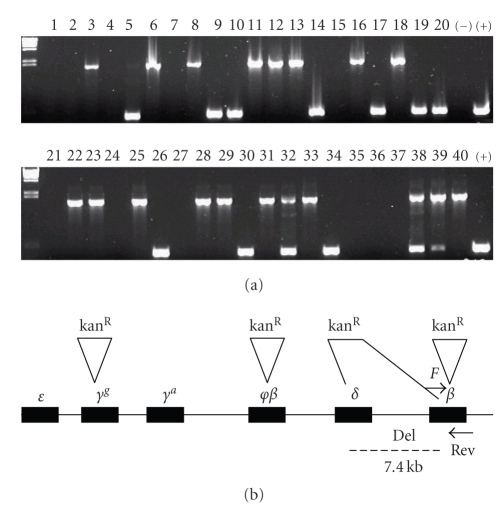
Figure 1.
PCR colony screening of kanR recombinant clones. (a) The upper band, 1.7 Kb in length (lanes 3, 6, 8, etc.), corresponds to the larger PCR product after insertion of recombination cassette into β-globin gene. 11 clones reveal lower wild-type band, 440 bp in length (lanes 5, 9, 10, etc.) as a result of recombination into other duplicated regions of the globin locus (γg and φβ). No PCR product (11 clones) is due to the δ-β deletion of the F primer binding site. Lanes 32,38 with double bands represent the colonies with heterogeneous BAC population within single colony. (b) Diagram of globin locus illustrating insertion of kanR cassette at four different globin genes.

