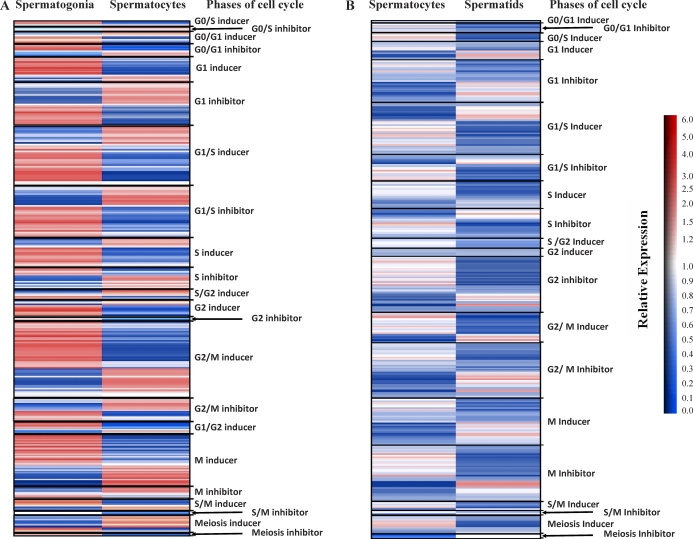
FIG. 4.
Differential expression of phase-specific cell-cycle genes during spermatogenesis. Heat maps depict the extent of differential expression of core cell-cycle genes during spermatogenesis. Cell-cycle genes belonging to phases including G0/S, G0/G1, G1, G1/S, S, S/G2, G2, G2/M, G1/G2, M, S/M, and Meiosis were further grouped as “inducers” or “inhibitors” of specific phases of the cell cycle based on reports of gene function derived from the literature. The color bar indicates the relative extent of differential expression between cell types (red, up-regulated expression; blue, down-regulated expression; white, little or no significant change in expression level). A) Transition from spermatogonia to spermatocytes. Of the 541 cell-cycle genes expressed in either spermatogonia, spermatocytes, or both, 307 were clustered according to cell-cycle phase annotations to produce this heat map. B) Transition from spermatocytes to spermatids. Of the 521 cell-cycle genes expressed in either spermatocytes, spermatids, or both, 162 were clustered as phase-specific genes according to cell-cycle phase annotations to produce this heat map.

