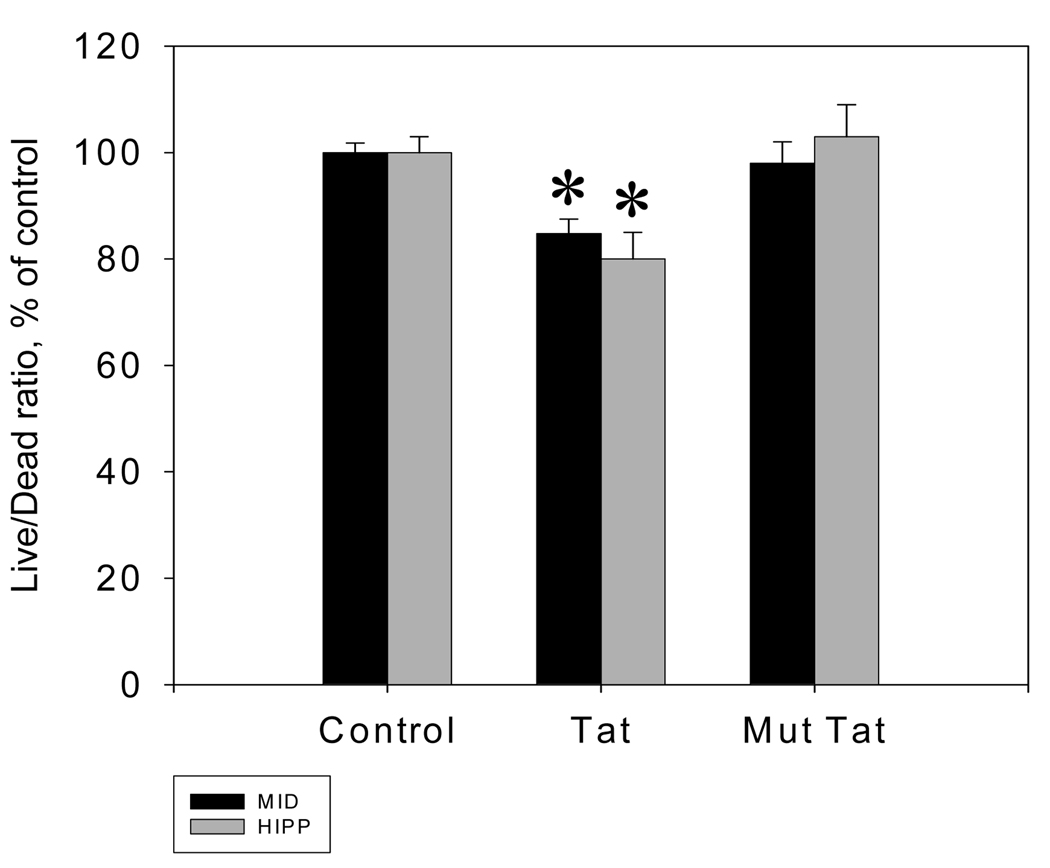
Figure 1.
Tat-mediated changes of neuronal viability in rat midbrain and hippocampal cell cultures. Changes in Calcein/Ethidium bromide fluorescence ratio (Live/Dead ratio) following 48 hours of exposure to 50 nM Tat 1–72 presented as mean % vs. vehicle control ± SEM; n of sister cultures analyzed = 16 per treatment. *- marks significant (P<0.05) difference between Tat-treated and non-treated control cell cultures. 50 nM Tat Δ31–61did not cause significant changes in cell viability following 48 hours of exposure.

