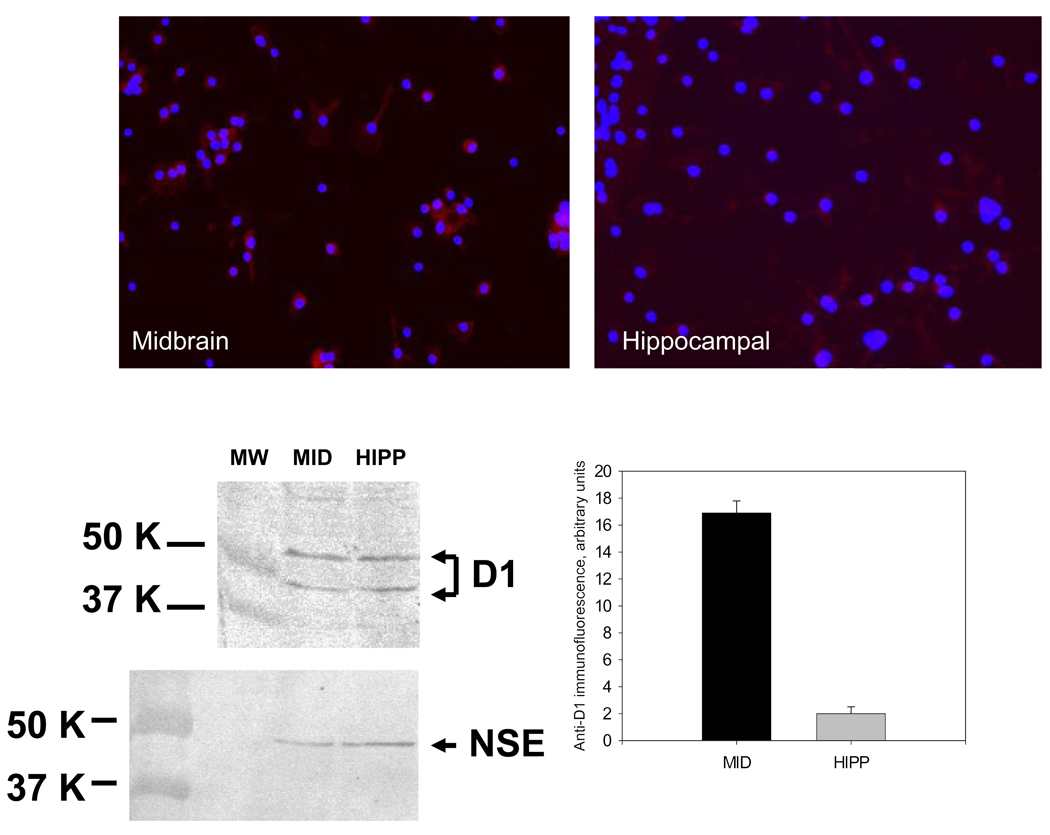
Figure 2.
Anti-D1 immunoreactivity in primary cultures of rat fetal midbrain and hippocampal neurons. Microscopic images of midbrain and hippocampal cell cultures show the representative result of anti-D1/Hoechst staining. Images were captured under 20X magnification. The graph shows comparative levels of anti-D1 immunofluorescence in midbrain and hippocampal cell cultures. Immunofluorescent signal was measured in a microplate reader using 590 excitation/645 emission filter set. Results presented as mean arbitrary units of anti-D1 immunofluorescence per culture (well) ± SEM. Number of midbrain or hippocampal sister cultures analyzed = 8. Images of Western blots show the results of the detection of D1 and NSE immunoreactive protein in cell lysates prepared from in 14-day old midbrain and hippocampal cell cultures.

