Abstract
The Syrian golden hamster drinks alcohol readily, but only achieves moderate blood alcohol levels, and does not go through withdrawal from alcohol. Because the hamster is a model of caloric homeostasis, both caloric content and reward value may contribute to the hamster’s alcohol consumption. The current study examines alcohol consumption in the hamster when a caloric or non-caloric sweet solution is concurrently available and caloric intake in the hamster before, during, and after exposure to either: alcohol, sucrose or saccharin. In Experiments 1 and 2, hamsters were given access to alcohol (15% v/v) and water; once alcohol consumption steadied, a bottle containing an ascending concentration of sucrose (99–614 mM) or saccharin (2–10 mM), or water was added. In Experiment 3, hamsters were given access to alcohol (15% v/v), sucrose (614 mM), saccharin (4 mM), or a second water bottle for 14 days. After the second bottle was removed, measurements continued for 14 days. Sucrose exposure suppressed alcohol consumption at concentrations lower in calories than the alcohol solution. Saccharin exposure failed to suppress alcohol consumption. Exposure to sucrose and alcohol but not saccharin decreased food intake. Decreased alcohol consumption in response to a caloric sweetener and decreased food intake during alcohol exposure support that alcohol consumption by the hamster is mediated by caloric content. However, suppression of alcohol intake by a sucrose solution of lower caloric content and the equivalent intake of individual alcohol, sucrose and saccharin solutions support a role for reward value in alcohol consumption.
Keywords: alcoholism, caloric balancing, ethanol, reward
Introduction
The Syrian golden hamster (Mesocricetus auratus) has been used as a research model for studies of alcohol intake [1–5], but also of gustation [6] and caloric balancing [7]. The hamster readily consumes solutions of 15–30% alcohol [2], solutions of 50–450 mM sucrose [7] and solutions of 1–3 mM saccharin [6], and prefers these solutions to water. Previous studies have suggested that the golden hamster may consume alcohol for both its caloric content and its pharmacological effects. Although the effects of pharmacological interventions on alcohol intake in the hamster are similar to those seen in other alcohol-preferring rodents, the hamster’s pattern of alcohol consumption differs from that seen in these other rodent models. Specifically, the golden hamster is a model of moderate alcohol drinking – it tends to drink alcohol at a steady rate during its waking period, but achieves only moderate blood alcohol levels (approximately 2 mM) [8, 9] and fails to exhibit signs of physiological withdrawal following cessation of chronic alcohol drinking [10].
We have used the hamster as an animal model of co-occurring schizophrenia and alcohol abuse in studies of the effects of antipsychotic drugs on alcohol consumption. The golden hamster has strong predictive validity for the ability of antipsychotics to decrease alcohol consumption in patients with schizophrenia; the atypical antipsychotic clozapine decreases alcohol intake in both hamsters [1, 3] and humans [11], while the typical antipsychotic haloperidol fails to decrease alcohol intake in either [3, 11]. However, In order to understand the effects of pharmacological treatments on alcohol intake in the hamster, we need to understand the factors underlying the hamster’s consumption of alcohol.
To test whether caloric content is a more significant factor than reward value in consumption of alcohol and other rewarding fluids by the golden hamster, the current studies examine changes in alcohol intake and food intake when an additional palatable fluid – either the caloric sweetener sucrose or the non-caloric sweetener saccharin – is made available. In addition, to determine whether the hamster maintains caloric homeostasis during exposure to each reward, we examine changes in food intake and total caloric intake prior to, during, and after cessation of free access to alcohol, sucrose or saccharin.
Methods
Animals
Adult, male Syrian golden hamsters (Mesocricetus Auratus), (90–110 g) were acquired from Harlan Inc. (Indianapolis, IN), maintained on a normal 12 h/12 h light/dark cycle, and individually housed in standard home cages with ad libitum access to food (Teklad Global 18% Protein Extruded Rodent Pellets; 3.4 Cal/g) and water. Animals in Experiments 1 and 2 were given continuous access to a bottle of water, a bottle of alcohol (15% v/v), and a bottle of either sucrose (99–614 mM), saccharin (2–10 mM), or water. Animals in Experiment 3 were given continuous access to a bottle of water and a second bottle containing either alcohol (15% v/v), sucrose (614 mM), saccharin (4 mM), or water. Within each experiment, the positions of the drinking bottles were rotated on a daily basis to prevent positional preference. A technician, blinded to the experimental conditions, measured fluid intake (by weight) every 24 hours, and food intake and body weight every 48 hours. Fluid intake was measured more frequently than food intake and body weight because previous studies in our laboratory have demonstrated that fluid consumption fluctuates more rapidly in response to environmental changes than either food consumption or body weight. Measurements took place at the same time each day (4 hours before the start of the dark cycle). All experiments were carried out in accordance with the National Institutes of Health guide for the care and use of Laboratory animals (NIH Publications No. 8023, revised 1978) and were approved by Dartmouth Institutional Animal Care and Use Committee.
Experiment 1: Preference for Alcohol or an Ascending Sucrose Concentration
In order to determine whether the hamster shows greater preference for alcohol or sucrose, and whether this preference depends on the caloric content of the available solutions, we first examined alcohol consumption in the presence or absence of another bottle containing an ascending concentration of the caloric sweetener sucrose. Sixteen golden hamsters were given access to 15% (v/v) alcohol and water for 14 days prior to pseudo-randomization into 2 groups (n=8 per group) in order to achieve similar baseline alcohol intake values (g/kg/day) (baseline alcohol intake was calculated using the last 4 days of access to only alcohol and water) and body weight between groups. One group was then given access to a third bottle of an ascending concentration of a sucrose solution (99–614 mM), and the other group was given access to a third bottle containing only water. The alcohol concentration was based on previous work demonstrating regular consumption by the hamster [1, 3], and the sucrose concentration range was chosen to fall within levels that the hamster prefers to water [1, 6], with the highest concentration (614 mM) being isocaloric to the alcohol solution. The concentration of the sucrose solution was increased every five days. Only the last four days at each concentration were used for data analysis in order to allow time for adaptation of behavior due to the change in sucrose concentration.
Experiment 2: Preference for Alcohol or an Ascending Saccharin Concentration
In order to further examine whether the hamster’s preference for sweet solutions over alcohol depends on the caloric content of the available solutions, we next examined alcohol consumption in the presence or absence of another bottle containing an ascending concentration of the non-caloric sweetener saccharin. Sixteen golden hamsters were given access to 15% (v/v) alcohol and water for 16 days prior to pseudo-randomization into 2 groups (n=8 per group) in order to achieve similar baseline alcohol intake values (g/kg/day) (baseline alcohol intake was calculated using the last 4 days of access to only alcohol and water) and body weight between groups. One group was then given access to a third bottle of an ascending concentration of saccharin solution (2–10 mM), and the other group was given access to a third bottle containing only water. The saccharin concentration range was chosen to fall within concentrations that the hamster prefers to water [6]; because saccharin is non-caloric, there is no equivalency to alcohol in terms of caloric content. The concentration of the saccharin solution was increased every five days. Only the last four days at each concentration were used for data analysis in order to allow time for adaptation of behavior due to the change in saccharin concentration.
Experiment 3: Caloric Intake during Exposure to Alcohol, Sucrose, or Saccharin
Finally, we examined the hamster’s food and total caloric intake during exposure to a single rewarding solution. Thirty-four golden hamsters were given access to water for 7 days prior to pseudo-randomization into 4 groups (n=8–9 per group) in order to achieve similar baseline water and food intake values (ml/kg/day or g/kg/day) (calculated using the last 4 days of the baseline period) and body weight between groups. Each group was then given access to a second bottle containing alcohol (15% v/v), sucrose (614 mM), saccharin (4 mM), or water for 14 days. After this 14-day period, the second bottle was removed, and water and food intake, as well as body weight, were measured for 14 days. The alcohol and sucrose concentrations were chosen to be isocaloric; the saccharin concentration was chosen because the hamster drank similar volumes of sucrose and saccharin at these concentrations in Experiments 1 and 2. Only the last six days of each week-long block were used for data analysis in order to allow time for adaptation of behavior due to changes in the available solutions.
Data analysis
Alcohol intake (g/kg or mL/kg) and preference (alcohol intake/total fluid intake), sucrose intake (g/kg or mL/kg) and preference (sucrose intake/total fluid intake), saccharin intake (g/kg or mL/kg) and preference (saccharin intake/total fluid intake), water intake (mL), food intake (g/kg), total caloric intake (cal/kg), and body weight (g) data were analyzed using one-way or two-way repeated measures analysis of variance (RMANOVA), using time (4-day concentration blocks for Experiments 1 and 2, and 6-day blocks for Experiment 3) and group as independent variables. When the analysis indicated that significant differences existed between treatments, Tukey’s post-hoc tests were used to examine differences between groups and between time-points. Significance was determined at p<0.05. Data are expressed as mean (M) ± standard error of the mean (SEM).
Results
Experiment 1: Preference for Alcohol or an Ascending Sucrose Concentration
Alcohol and Sucrose Intake
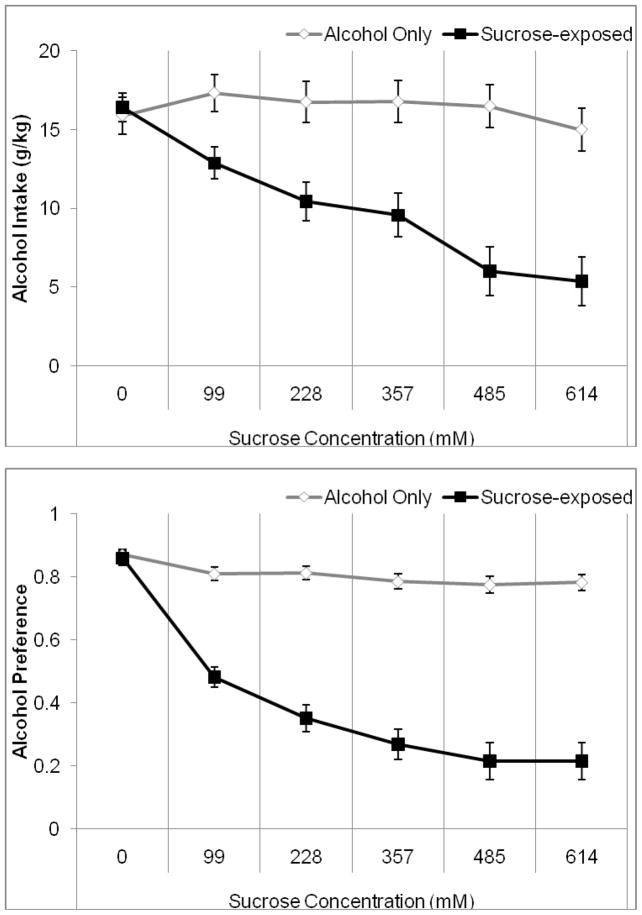
We first examined fluid and food consumption when alcohol was offered in addition to water or an ascending concentration of sucrose solution. Two-way RMANOVA indicated a significant effect of sucrose concentration, F(5,70)=23.25, p<0.001, and of group, F(1,14)=13.78, p<0.001, as well as a significant concentration by group interaction, F(5,70)=17.88, p<0.001 on alcohol intake. Tukey’s post-hoc tests revealed that the group exposed to sucrose drank significantly less alcohol than the water-only group for the duration of sucrose exposure (p<0.05). In addition, the sucrose-exposed group drank significantly less alcohol when exposed to the highest (485 and 614 mM) sucrose concentrations as compared to the lowest (0, 99, and 228 mM) concentrations (p<0.05) (Figure 1A). Two-way RMANOVA indicated a significant effect of sucrose concentration, F(5,70)=44.72, p<0.001, and of group, F(1,14)=164.42, p<0.001, as well as a significant concentration by group interaction, F(5,70)=43.08, p<0.001 on alcohol preference. Tukey’s post-hoc tests revealed that the group exposed to sucrose showed significantly lower alcohol preference than the water-only group for the duration of sucrose exposure (p<0.05). In addition, the sucrose-exposed group showed significantly lower alcohol preference when exposed to the higher concentrations of sucrose (357, 485, and 614 mM) as compared to the lowest (0 and 99 mM) concentrations (p<0.05) (Figure 1B). Thus, availability of sucrose, even at concentrations of lower caloric content than alcohol, decreased preference for alcohol.
Figure 1.
Average alcohol intake and preference during the last four days of exposure to each sucrose concentration. A) Alcohol intake decreased when sucrose was made available. Concentrations of 485–614 mM sucrose produced maximal suppression of alcohol intake. B) Alcohol preference decreased when sucrose was made available. Concentrations of 357–614 mM sucrose produced maximal suppression of alcohol preference (Mean ± SEM).
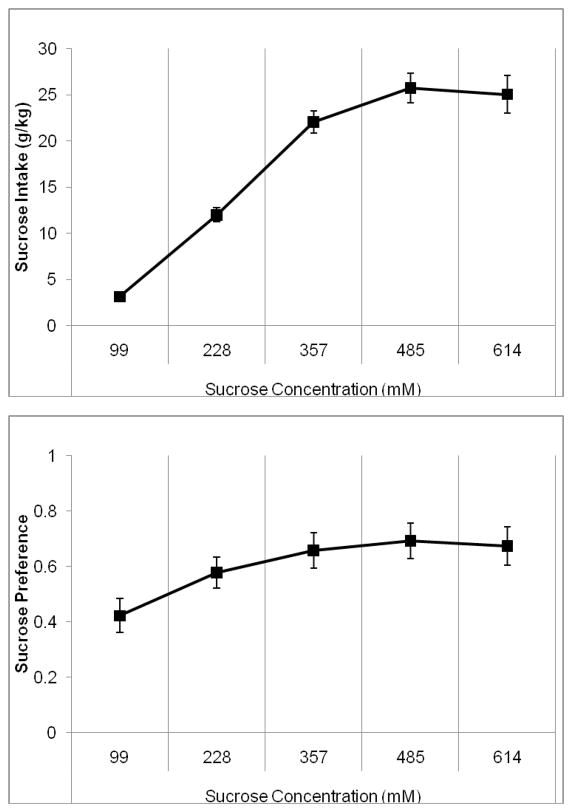
One-way RMANOVA indicated a significant effect of sucrose concentration, F(4,24)=41.13, p<0.001 on sucrose intake. Tukey’s post-hoc tests revealed that sucrose intake increased steadily between the first through fourth sucrose concentrations (99–485 mM) (p<0.05), but there was no increase between the fourth and fifth sucrose concentrations (485–614 mM) (Figure 2A). One-way RMANOVA indicated a significant effect of sucrose concentration, F(4,24)=8.60, p<0.001 on sucrose preference. Tukey’s post-hoc tests revealed that sucrose preference only increased significantly between the first and second sucrose concentrations (99–228 mM) (p<0.05); there were no other significant differences (Figure 2B). Although concentration was a factor in the hamster’s preference for sucrose, preference reached a ceiling level at a concentration of lower caloric content than the available alcohol.
Figure 2.
Average sucrose intake and preference during the last four days at each concentration when presented with alcohol. A) Sucrose intake increased significantly between each of the first four sucrose concentrations (99–485 mM) but not between the fourth and fifth concentrations. B) Sucrose preference increased between the first and second sucrose concentrations (99–228 mM), then remained stable for the remainder of sucrose exposure (Mean ± SEM).
Water, Food, and Total Caloric Intake; Body Weight
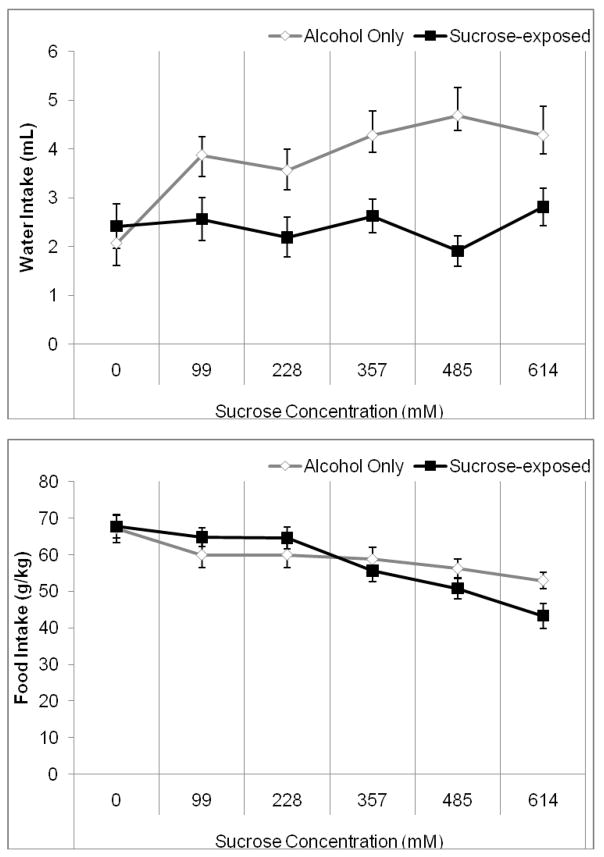
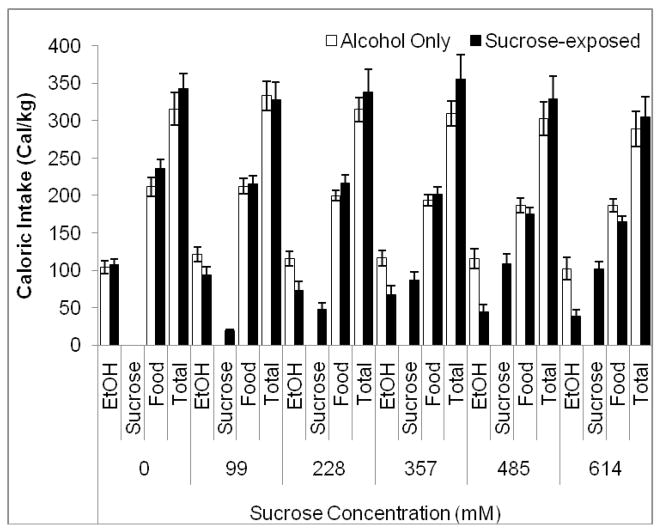
Two-way RMANOVA indicated a significant effect of sucrose concentration, F(5,70)=10.25, p<0.001, and of group, F(1,14)=8.72, p<0.01, as well as a significant concentration by group interaction, F(5,70)=3.56, p<0.01 on water intake. Tukey’s post-hoc tests revealed that the sucrose group drank significantly less water than the alcohol control group during the highest three sucrose concentrations (357–614 mM) (p<0.05) (Figure 3A). The increase in water intake in the alcohol-only group may be due to hamsters drinking more water when two water bottles are available rather than a single water bottle, as rodents show higher preference for more readily available fluids (i.e., those available from a greater number of bottles) [12]. Two-way RMANOVA indicated a significant effect of sucrose concentration, F(5,70)=15.15, p<0.001, no effect of group, but a significant concentration by group interaction, F(5,70)=4.24, p<0.01, on food intake. Tukey’s post-hoc tests revealed that the sucrose-exposed group ate significantly less food than the alcohol-only group during the final sucrose concentration (614 mM)(p<0.05) (Figure 3B). In addition, the sucrose-exposed group consumed significantly less food during the last two sucrose concentrations (485 and 614 mM) compared to the no-sucrose period (p<0.05), but there were no other significant differences (Figure 3B). Thus, exposure to a high concentration sucrose solution decreased caloric intake from food as well as from alcohol. Two-way RMANOVA indicated a significant effect of sucrose concentration, F(5,70)=205.39, p<0.001, no effect of group, but a significant concentration by group interaction, F(5,70)=8.09, p<0.001, on body weight. Post-hoc tests demonstrated an increase in weight over time across groups (p<0.05), but there were no differences between groups; there was a trend toward greater weight gain in the sucrose-exposed group (p=0.08) (Table 1). Finally, two-way RMANOVA indicated a significant effect of sucrose concentration, F(5,70)=11.04, p<0.001, no effect of group, but a significant concentration by group interaction, F(5,70)=7.70, p<0.001 on total caloric intake. Planned comparison t-tests revealed that the sucrose-exposed group consumed more calories than the alcohol alone group during the third sucrose concentration (357 mM) (p<0.05). Additionally, overall caloric intake increased between the second and third sucrose concentrations (228–357 mM), then decreased steadily between the third through fifth sucrose concentrations (357–614 mM) (p<0.05) (Figure 4).
Figure 3.
Water and food intake during exposure to alcohol and sucrose. A) The alcohol control group consumed more water during the latter three concentrations of exposure to sucrose (357–614 mM). B) The group exposed to sucrose ate significantly less during the final two sucrose concentrations (485–614 mM) than it did prior to sucrose exposure, and also ate less than the alcohol control group during the final sucrose concentration (614 mM) (Mean ± SEM).
Table 1.
Changes in body weight (g) over time in each experiment. Although there were significant increases in weight over time across groups, there were no significant differences between groups within any experiment (Mean (SEM)).
| Experiment 1 | Sucrose Concentration (mM) | |||||
|---|---|---|---|---|---|---|
| 0 | 99 | 228 | 357 | 485 | 614 | |
| Alcohol Only | 104.5 (2.6) | 107.8(2.6) | 111.4 (2.6) | 115.1 (2.5) | 117.6 (2.5) | 121.6 (2.5) |
| Sucrose-exposed | 103.1 (2.3) | 108.1 (2.4) | 113.25 (2.4) | 118.1 (2.6) | 122.6 (2.8) | 128.0 (2.8) |
| Experiment 2 | Saccharin Concentration (mM) | |||||
| 0 | 2 | 4 | 6 | 8 | 10 | |
| Alcohol Only | 99.8 (1.4) | 100.9 (1.4) | 101.6 (1.4) | 102.3 (1.3) | 103.0 (1.3) | 103.8 (1.3) |
| Saccharin-exposed | 100.4 (1.5) | 101.4 (1.5) | 102.2 (1.6) | 102.9 (1.7) | 103.6 (1.6) | 104.3 (1.5) |
| Experiment 3 | Week | |||||
| Baseline | Reward 1 | Reward 2 | Post-exposure 1 | Post-exposure 2 | ||
| Saccharin | 95.1 (1.8) | 98.2 (1.8) | 103.3 (2.1) | 109.4 (2.4) | 115.6 (2.7) | |
| Water | 95.5 (1.1) | 97.9 (1.1) | 102.9 (1.0) | 109.5 (1.3) | 115.8 (1.6) | |
| Ethanol | 97.9 (2.3) | 101.3 (1.7) | 107.2 (1.5) | 113.9 (1.3) | 119.4 (0.8) | |
| Sucrose | 96.3 (3.7) | 101.4 (3.9) | 107.9 (4.3) | 112.6 (4.1) | 116.6 (3.6) | |
Figure 4.
Total caloric intake during exposure to alcohol and sucrose. The group exposed to sucrose consumed more calories than the alcohol control group only during the third sucrose concentration (357 mM). Additionally, caloric intake in both groups increased between the second and third sucrose concentrations (228–357 mM) and then decreased steadily until the final sucrose concentration (614 mM) (Mean ± SEM).
Experiment 2: Preference for Alcohol or an Ascending Saccharin Concentration
Alcohol and Saccharin Intake
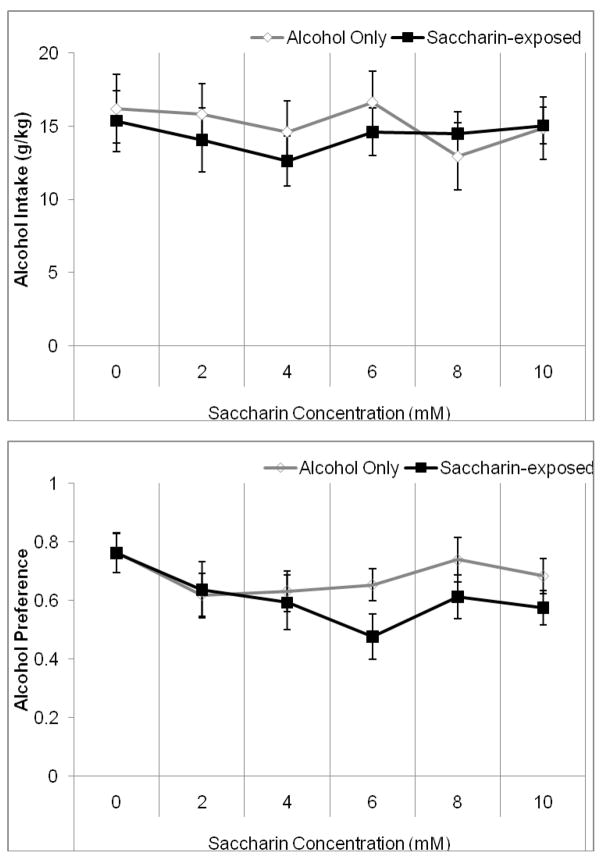
We next examined fluid and food consumption when alcohol was offered in addition to water or an ascending concentration of saccharin solution. Two-way RMANOVA indicated no significant effects on alcohol intake but a significant effect of saccharin concentration, F(5,70)=13.22, p<0.001 on alcohol preference (Figure 5A and B). Tukey’s post-hoc tests revealed a significant decrease in alcohol preference between the alcohol baseline period and the first saccharin concentration (2 mM) (p<0.05) and a significant increase in alcohol preference in the fourth saccharin concentration (8 mM) compared to the other saccharin concentrations (p<0.05). However, there were no differences between groups, suggesting that exposure to saccharin – unlike sucrose – does not decrease the hamster’s preference for alcohol.
Figure 5.
Average alcohol intake and preference during the last four days of exposure to each saccharin concentration. A) There were no significant changes in alcohol intake. B) Alcohol preference decreased in the first saccharin concentration (2 mM) and increased in the fourth saccharin concentration (8 mM), but there were no differences between groups (Mean ± SEM).
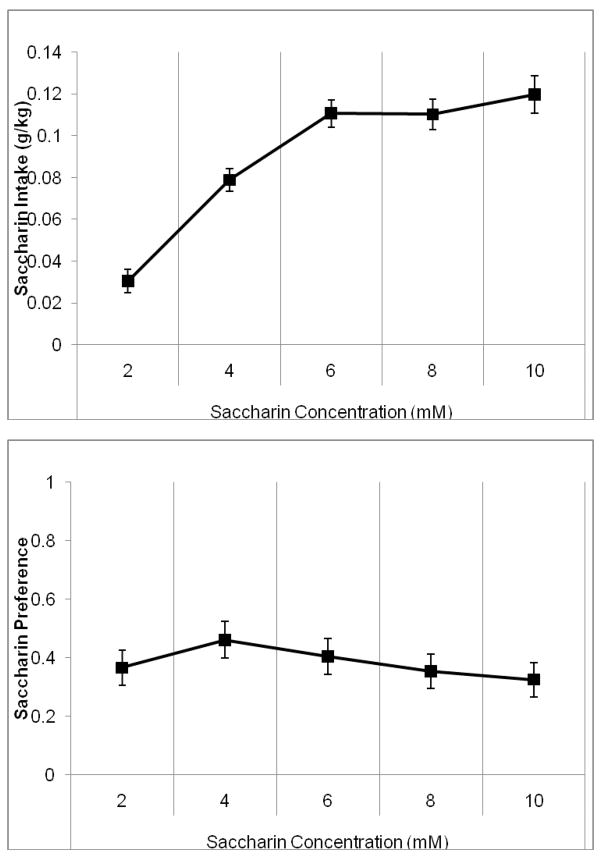
One-way RMANOVA indicated a significant effect of saccharin concentration, F(4,28)=19.65, p<0.001 on saccharin intake. Tukey’s post-hoc tests revealed that saccharin intake increased significantly between first and second saccharin concentration and again between the second and third saccharin concentrations (2–6 mM) (p<0.05), but there were no other significant differences (Figure 6A). One-way RMANOVA indicated a significant effect of saccharin concentration, F(4,28)=4.16, p<0.05 on saccharin preference. Tukey’s post-hoc tests demonstrated that the saccharin preference increased between the first and second saccharin concentrations (2–4 mM), then decreased between the second and third and again between the third and fourth saccharin concentrations (4–8 mM) (p<0.05) (Figure 6B). Thus, although the hamsters consumed progressively more saccharin at the lower concentrations, this was due solely to increases in concentration and not to any increases in the volume of saccharin consumed, and the preference for saccharin dropped with higher concentrations.
Figure 6.
Average saccharin intake and preference during the last four days at each concentration when presented with alcohol. A) Saccharin intake increased significantly between each of the first three sucrose concentrations (2–6 mM) but there were no other differences. B) Saccharin preference increased between the first and second saccharin concentrations (2–4 mM), then decreased between each of the next three saccharin concentrations (4–8 mM) (Mean ± SEM).
Water, Food, and Total Caloric Intake; Body Weight
Two-way RMANOVA indicated a significant effect of saccharin concentration, F(5,70)=20.96, p<0.001, and of group, F(1,14)=13.96, p<0.01, as well as a significant concentration by group interaction, F(5,70)=11.21, p<0.001 on water intake. Tukey’s post-hoc tests revealed that the saccharin group drank significantly less water than the alcohol control group throughout saccharin exposure (p<0.05) (Figure 7A). Two-way RMANOVA indicated a significant effect of saccharin concentration, F(5,70)=6.00, p<0.001 but no effect of group and no concentration by group interaction on food intake. Planned comparison t-tests revealed that food intake decreased across groups between the alcohol baseline period and the first saccharin concentration (2 mM), and again between the third and fourth saccharin concentrations and between the fourth and fifth saccharin concentrations (6–10 mM) (p<0.05) (Figure 7B). Thus, exposure to saccharin decreased water intake but did not decrease intake of alcohol or food. Two-way RMANOVA indicated a significant effect of saccharin concentration, F(5,70)=191.95, p<0.001; there was no effect of group and no concentration by group interaction on body weight. Post-hoc tests demonstrated an increase in weight over time across groups (p<0.05) (Table 1). Finally, two-way RMANOVA indicated a significant effect of saccharin concentration, F(5,70)=7.45, p<0.01, but no effect of group and no concentration by group interaction, on total caloric intake. Planned comparison t-tests revealed that total caloric intake during the fourth and fifth saccharin concentrations (8–10 mM) was significantly lower than caloric intake during the alcohol baseline period and the first and third saccharin concentrations (2 and 6 mM) (p<0.05) (data not shown). Although there was a trend towards decreased caloric intake over time, there were no differences between groups; thus, saccharin exposure did not alter total caloric intake.
Figure 7.
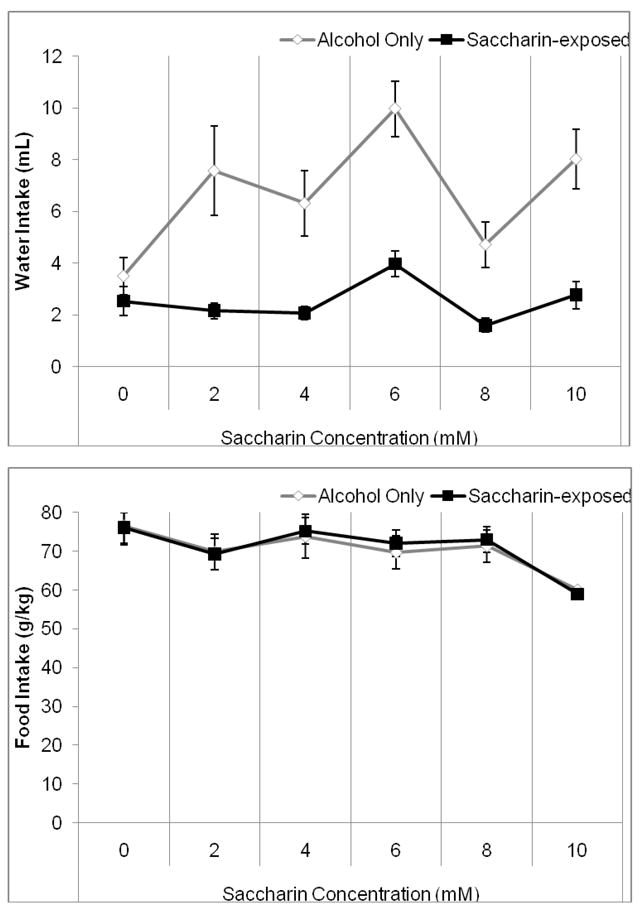
Water and food intake during exposure to alcohol and saccharin. A) The saccharin-exposed group drank significantly less water than the alcohol control group throughout exposure to saccharin. B) Food intake decreased between the alcohol baseline period and the first saccharin concentration (2 mM) and again between the third and fifth saccharin concentrations (6–10 mM) but there were no differences between groups (Mean ± SEM).
Experiment 3: Caloric Intake Before, During, and Following Exposure to a Reward
Reward (Alcohol, Sucrose, or Saccharin) Intake
Finally, we explored the preference for alcohol, sucrose, or saccharin solutions when they are available in a two-bottle choice versus water. The concentration of sucrose (614 mM) was chosen based on high consumption of it in the first experiment and because it is isocaloric to the alcohol concentration (15% v/v) used in these experiments. The saccharin concentration (4 mM) was chosen based on the hamster’s highest preference during the second experiment [6]. Two-way RMANOVA indicated a significant effect of time, F(1,30)=16.65, p<0.001, and of group, F(3,28)=48.32, p<0.001, as well as a significant time by group interaction, F(3,28)=5.35, p<0.01 on reward intake (g/kg). Tukey’s post-hoc tests revealed that significantly more sucrose and alcohol were consumed compared to water and saccharin during both weeks of exposure (p<0.05); additionally, more alcohol was consumed than sucrose during the first week of exposure but not during the second week (p<0.05). However, because the concentration of saccharin was so low compared to those of alcohol and sucrose, we did an additional analysis to examine intake by volume. Two-way RMANOVA indicated a significant effect of time, F(1,30)=30.82, p<0.001, and of group, F(3,28)=6.15, p<0.01, as well as a significant time by group interaction, F(3,28)=3.58, p<0.05 on reward intake (mL/kg). Tukey’s post-hoc tests revealed a trend toward greater saccharin, sucrose, and alcohol consumption compared to water during the first week (p=0.09) and significantly greater saccharin, sucrose and alcohol consumption compared to water during the second week of exposure (p<0.05) (Figure 8A). Two-way RMANOVA indicated a significant effect of time, F(1,30)=27.90, p<0.001, and of group, F(3,28)=5.204, p<0.01, but no time by group interaction on reward preference. Tukey’s post-hoc tests revealed significantly greater saccharin, sucrose and alcohol preference compared to water during both weeks of exposure (p<0.05) but no other differences (Figure 8B). Thus, the hamster shows nearly identical intake of, and preference for, all three reward solutions although they vary in both taste and caloric content.
Figure 8.
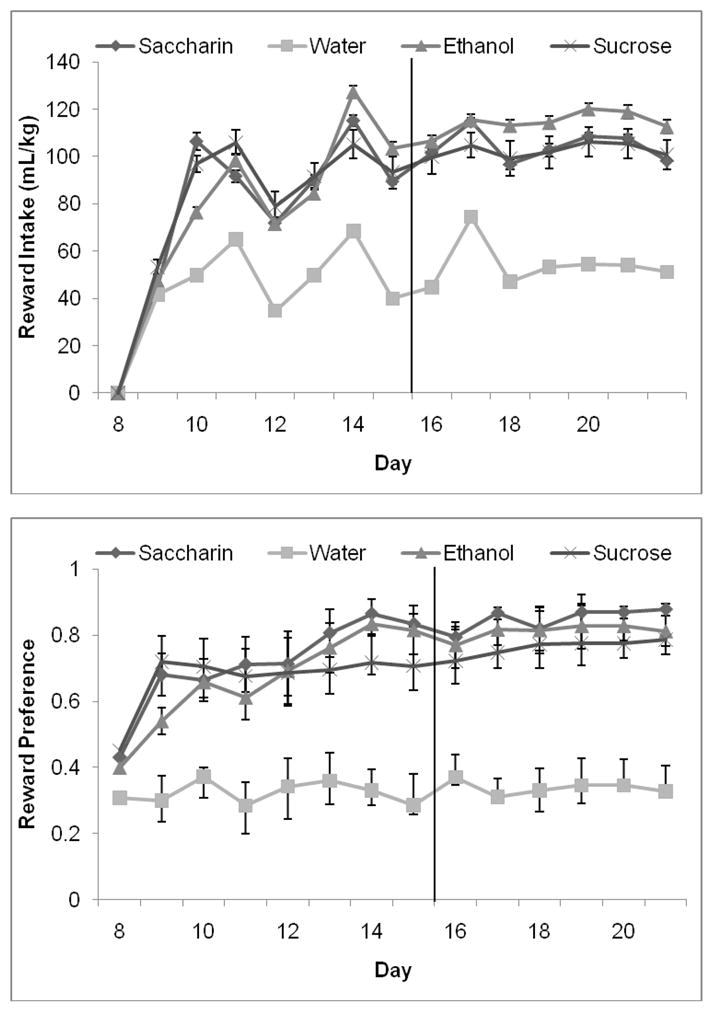
Reward intake and preference. A) There was greater consumption of alcohol, saccharin, and sucrose than water in the second week of exposure to the rewards, but there were no differences in intake of the three rewarding solutions. B) There was greater preference for alcohol, saccharin, and sucrose than water during both weeks of exposure to the rewards, but there were no differences in preference for the three rewarding solutions (Mean ± SEM).
Water, Food, and Total Caloric Intake; Body Weight
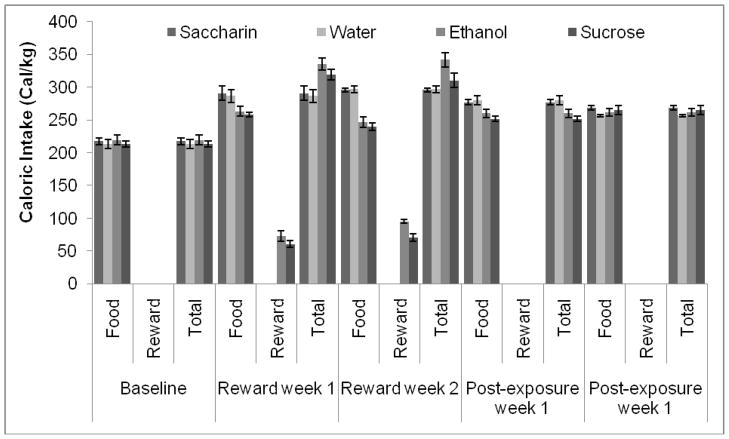
Two-way RMANOVA indicated a significant effect of time, F(3,90)=136.91, p<0.001, and of group, F(9,90)=4.18, p<0.05 and a significant time by group interaction, F(9,90)=2.79, p<0.05 on water intake. Tukey’s post-hoc tests revealed significantly lower water intake in all three groups exposed to a reward compared to the group exposed only to water during both weeks of exposure (p<0.05), but there were no differences between groups in the non-exposure periods. In addition, post-hoc tests showed that the water-only group drank significantly more water when a second water bottle was available (p<0.05), while the other three groups drank significantly less water during the second week of reward exposure compared to both the baseline and post-exposure periods (p<0.05) (Figure 9A). Two-way RMANOVA indicated a significant effect of time, F(3,90)=294.17, p<0.001, no effect of group but a time by group interaction, F(9,90)=3.03, p<0.05 on food intake. Tukey’s post-hoc tests revealed that the overall food intake increased between the baseline and reward exposure periods (p<0.05). Post-hoc tests also revealed that the alcohol- and sucrose-exposed groups ate significantly less than the groups exposed to water and saccharin during the second week of exposure (p<0.05); the sucrose-exposed group also ate significantly less during the first week of exposure (p<0.05), but there was only a non-significant trend towards lower consumption in the alcohol-exposed group (p=0.1). There were no group differences in food intake during the baseline or post-exposure periods (Figure 9B). Two-way RMANOVA indicated a significant effect of time, F(3,90)=697.12, p<0.001, but no effect of group and no time by group interaction on body weight. Post-hoc tests demonstrated an increase in weight over time across groups (p<0.05) (Table 1). Finally, two-way RMANOVA indicated a significant effect of time, F(3,90)=20.63, p<0.001, no effect of group, but a significant time by group interaction, F(9,90)=8.67, p<0.001 on total caloric intake. Planned comparison t-tests revealed that the alcohol- and sucrose-exposed groups consumed more calories during the first week of exposure than the saccharin-exposed and water only groups (p<0.05). The sucrose-exposed group returned to a baseline level of caloric intake by the second week of exposure, but caloric intake in the alcohol-exposed group remained elevated compared to the other groups (p<0.05). The alcohol- and sucrose-exposed groups also consumed more calories during both weeks of exposure than they did during the baseline or post-exposure periods (p<0.05) (Figure 10). Although the hamster did not maintain a set level of caloric intake when rewarding solutions were made available and then removed, the changes in food intake during these periods suggest an attempt at caloric balancing.
Figure 9.
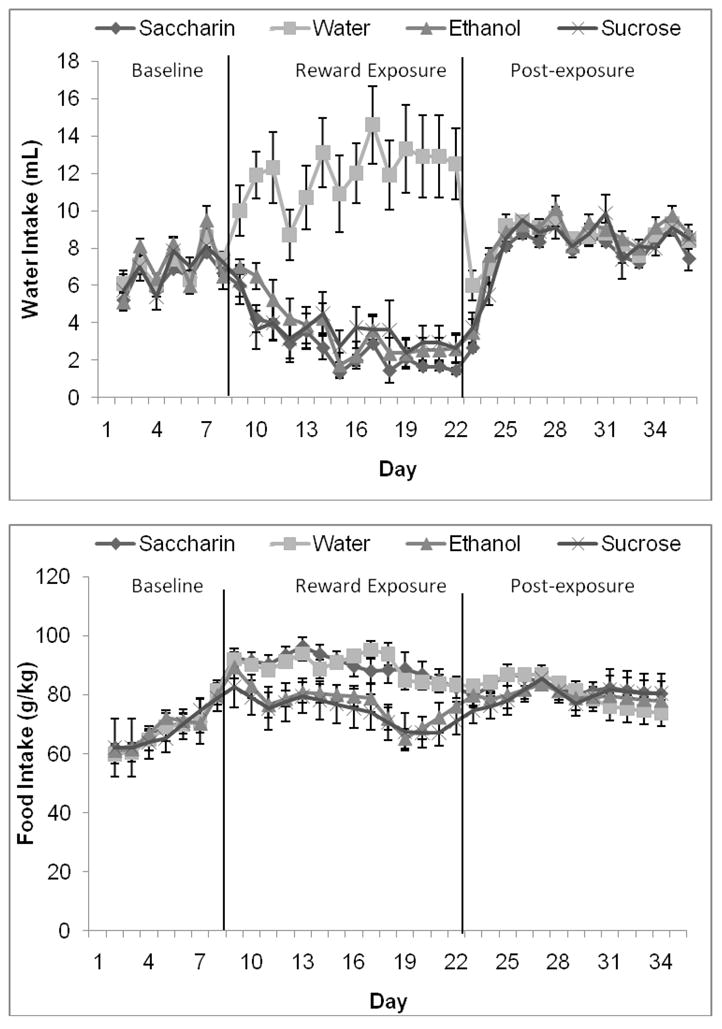
Water and food intake before, during, and after exposure to alcohol, sucrose, and saccharin. A) Water intake decreased in all three groups exposed to rewarding solutions during both weeks of exposure to the rewards, and increased in the group exposed only to water during the same period. B) Food intake was greater in all groups during the two weeks of exposure to the rewards than during the week of baseline measurements. In addition, the group exposed to sucrose ate less than the water- and saccharin-exposed groups during both weeks of exposure to the rewards, and the group exposed to alcohol ate less than the water- and saccharin-exposed groups during the second week of exposure to the rewards (Mean ± SEM).
Figure 10.
Total caloric intake before, during, and after exposure to alcohol, sucrose, and saccharin. The alcohol- and sucrose-exposed groups consumed more calories during the first week of exposure to the rewards than the saccharin-exposed and water only groups; the sucrose-exposed group returned to a baseline level of caloric intake by the second week of exposure to the rewards, but the alcohol-exposed group remained elevated compared to the other groups (Mean ± SEM).
Discussion
In the current study, we demonstrate that the golden hamster prefers alcohol, sucrose, and saccharin to water in a free access drinking paradigm, but that there is a hierarchy in the reward value of these solutions. Free access to the caloric sweetener sucrose decreases alcohol consumption, but free access to the non-caloric sweetener saccharin does not. In addition, in a separate set of studies (Gulick and Green, in preparation), we have noted that access to either alcohol or sucrose decreases saccharin consumption. Together, these findings suggest a reward hierarchy in which sucrose is more rewarding than alcohol, and both sucrose and alcohol are more rewarding than saccharin. However, the hamster’s preference for alcohol may depend on other factors in addition to the rewarding, pharmacological effects of alcohol. We show that food intake is lower in animals exposed to sucrose or alcohol than in animals exposed to saccharin or water, although food intake returns to baseline levels once the rewarding solutions are removed. These data indicate that the golden hamster will maintain caloric homeostasis by balancing caloric intake from food and caloric solutions. Thus, changes in food and reward intake when a caloric solution becomes available may represent compensatory attempts to maintain caloric homeostasis.
One alternative interpretation of the data is that the differential effects of sucrose and saccharin availability on alcohol consumption are due to changes in the blood alcohol concentrations achieved when alcohol is consumed concurrently with the sweeteners. Although there is some evidence that sucrose may increase alcohol metabolism – thus decreasing blood alcohol concentration and possibly limiting the rewarding effects of alcohol – under certain circumstances [13], studies have demonstrated that chronic consumption of sucrose or saccharin with alcohol does not significantly alter blood alcohol levels compared to chronic consumption of alcohol alone [14, 15].
Taken together, the current data support the possibility that the golden hamster consumes alcohol for both reward value and caloric content. As noted above, our group has studied alcohol drinking in the hamster as a possible model of alcohol abuse in schizophrenia, and to test the effects of antipsychotic medications on alcohol drinking. We have presented a neurobiologic formulation suggesting: (1) that alcohol abuse in schizophrenia is based on the ability of alcohol to partially ameliorate a reward circuit dysfunction in patients with schizophrenia [16]; and (2) that treatments that decrease alcohol drinking in patients with schizophrenia also ameliorate this reward circuit dysfunction. Studies of animal models of schizophrenia note that such animals are highly motivated to consume rewarding substances, e.g., they consume high concentration sucrose solutions [17]. Just as patients with schizophrenia may consume rewarding substances to ameliorate a brain reward circuit dysfunction, the golden hamster may consume alcohol, sucrose and saccharin for their positive effects on the reward circuit.
Sucrose decreased alcohol intake at concentrations of lower caloric content than the available alcohol solution. The consummatory behavior of hamsters follows the ‘Least Consummatory Effort’ principle, in which hamsters choose to drink from a more concentrated solution when given the choice between two solutions of the same reward value [7]. Thus, if the hamster is consuming alcohol solely for calories, it should continue to prefer alcohol to sucrose until the solutions become isocaloric. Sucrose is rewarding in the hamster, as demonstrated by greater operant responding for sucrose than water [18]; the shift in preference from alcohol to sucrose may occur as the sucrose solution becomes more rewarding. In order to further examine the reward value of alcohol compared to sucrose and saccharin, we have initiated a series of experiments using operant conditioning to determine the motivation of the hamster to consume each of these rewards.
Interestingly, the hamsters displayed different sweetness preference depending on the type of sweetener available. For both sucrose and saccharin, total intake (g/kg) initially increased as the concentrations increased, but then reached a plateau – sucrose at 485 mM and saccharin at 6 mM. These findings support previous research demonstrating a strong preference for sweet solutions in the hamster [6], but also suggest that there is some balance of sweetness and caloric content that determines the intake of these sweet solutions. In addition, alcohol is not sweet, yet the hamster consumes a similar volume of alcohol to sucrose and saccharin in the two-bottle test (Experiment 3), again suggesting that multiple factors contribute to the intake of alcohol and other rewarding solutions in this animal, and that sweetness, high caloric content, and pharmacological effects may all factor into the reward value of solutions.
The pattern of preferences for varying sucrose and saccharin concentrations (the preference for sucrose increased over the first few concentrations then reached a plateau and the preference for saccharin decreased at higher concentrations) is similar to that seen in other rodents [19], suggesting that the hamster’s responses to reward may be very similar those in other alcohol-preferring rodents. Our ongoing experiments with operant responding should provide further information about the hamster’s reward-driven behavior.
The hamster’s ability to maintain caloric homeostasis was differentially affected by exposure to each of the rewards. The hamster can clearly differentiate between caloric and non-caloric solutions, as there were no changes in alcohol or food intake in hamsters exposed to saccharin. Alcohol, however, impaired the hamster’s ability to balance caloric intake. In Experiment 3, the sucrose-exposed group decreased their food intake within the first week of exposure to the reward and returned to baseline levels of total caloric intake (as determined by the water-only group) by the second week of exposure. The alcohol-exposed group decreased their food intake in the second week of exposure but not robustly enough to return their total caloric intake back to baseline levels. This suggests that the pharmacological effects of alcohol, but not sucrose, may interfere with the hamster’s ability to regulate caloric homeostasis.
Together, these data portray the complex factors underlying the consumption of alcohol and other rewarding solutions by the Syrian golden hamster. Although taste and caloric content may contribute to the hamster’s consummatory behaviors, the reward value of the solutions is likely to be a determining factor in consumption. Thus, although future studies should examine the hamster’s motivation to consume alcohol in paradigms other than the free access protocol employed in the current experiments, the hamster remains a valid model in which to examine potential pharmacological manipulations of alcohol consumption.
Acknowledgments
This work was supported by the National Institute of Alcohol Abuse and Alcoholism (AIG; 1R03AA014644).
Footnotes
Publisher's Disclaimer: This is a PDF file of an unedited manuscript that has been accepted for publication. As a service to our customers we are providing this early version of the manuscript. The manuscript will undergo copyediting, typesetting, and review of the resulting proof before it is published in its final citable form. Please note that during the production process errors may be discovered which could affect the content, and all legal disclaimers that apply to the journal pertain.
References
- 1.Chau DT, Gulick D, Xie H, Dawson R, Green AI. Clozapine chronically suppresses alcohol drinking in Syrian golden hamsters. Neuropharmacology. 2009 doi: 10.1016/j.neuropharm.2009.10.006. [DOI] [PMC free article] [PubMed] [Google Scholar]
- 2.DiBattista D. Voluntary ethanol consumption and obesity in golden hamsters. Physiology & behavior. 1986;36:41–5. doi: 10.1016/0031-9384(86)90070-3. [DOI] [PubMed] [Google Scholar]
- 3.Green AI, Chau DT, Keung WM, Dawson R, Mesholam RI, Schildkraut JJ. Clozapine reduces alcohol drinking in Syrian golden hamsters. Psychiatry Res. 2004;128:9–20. doi: 10.1016/j.psychres.2004.05.005. [DOI] [PubMed] [Google Scholar]
- 4.DiBattista D, McKenzie TL, Hollis-Walker L. Cholecystokinin reduces ethanol consumption in golden hamsters. Alcohol. 2003;29:173–81. doi: 10.1016/s0741-8329(03)00036-3. [DOI] [PubMed] [Google Scholar]
- 5.Piercy KT, Myers RD. Tomato juice, chocolate drink, and other fluids suppress volitional drinking of alcohol in the female Syrian golden hamster. Physiol Behav. 1995;57:1155–61. doi: 10.1016/0031-9384(95)00026-f. [DOI] [PubMed] [Google Scholar]
- 6.Frank ME, Wada Y, Makino J, Mizutani M, Umezawa H, Katsuie Y, et al. Variation in intake of sweet and bitter solutions by inbred strains of golden hamsters. Behavior genetics. 2004;34:465–76. doi: 10.1023/B:BEGE.0000023651.99481.d5. [DOI] [PubMed] [Google Scholar]
- 7.Wong R. Caloric balancing and sucrose intake of hamsters and gerbils. The American journal of psychology. 1986;99:355–65. [PubMed] [Google Scholar]
- 8.Keung WM, Kunze L, Li DJ, Lazo O. Volitional ethanol consumption affects overall serotonin metabolism in Syrian golden hamsters (Mesocricetus auratus) Biochem Biophys Res Commun. 2000;271:823–30. doi: 10.1006/bbrc.2000.2718. [DOI] [PubMed] [Google Scholar]
- 9.Chau DT, Gulick D, Xie H, Dawson R, Green AI. Clozapine chronically suppresses alcohol drinking in Syrian golden hamsters. Neuropharmacology. 2010;58:351–6. doi: 10.1016/j.neuropharm.2009.10.006. [DOI] [PMC free article] [PubMed] [Google Scholar]
- 10.McMillan DE, Ellis FW, Frye GD, Pick JR. Failure of signs of physical dependence to develop in hamsters after prolonged consumption of large doses of ethanol. Pharmacology Biochemistry & Behavior. 1977;7:55–7. doi: 10.1016/0091-3057(77)90010-7. [DOI] [PubMed] [Google Scholar]
- 11.Green AI, Noordsy DL, Brunette MF, O’Keefe C. Substance abuse and schizophrenia: pharmacotherapeutic intervention. J Subst Abuse Treat. 2008;34:61–71. doi: 10.1016/j.jsat.2007.01.008. [DOI] [PMC free article] [PubMed] [Google Scholar]
- 12.Tordoff MG, Bachmanov AA. Mouse taste preference tests: why only two bottles? Chem Senses. 2003;28:315–24. doi: 10.1093/chemse/28.4.315. [DOI] [PMC free article] [PubMed] [Google Scholar]
- 13.Wu KL, Chaikomin R, Doran S, Jones KL, Horowitz M, Rayner CK. Artificially sweetened versus regular mixers increase gastric emptying and alcohol absorption. Am J Med. 2006;119:802–4. doi: 10.1016/j.amjmed.2006.02.005. [DOI] [PubMed] [Google Scholar]
- 14.Czachowski CL, Samson HH, Denning CE. Blood ethanol concentrations in rats drinking sucrose/ethanol solutions. Alcohol Clin Exp Res. 1999;23:1331–5. [PubMed] [Google Scholar]
- 15.Matthews DB, Overstreet DH, Rezvani AH, Devaud LL, Morrow AL. Effects of sweetened ethanol solutions on ethanol self-administration and blood ethanol levels. Pharmacol Biochem Behav. 2001;68:13–21. doi: 10.1016/s0091-3057(00)00458-5. [DOI] [PubMed] [Google Scholar]
- 16.Green AI, Zimmet SV, Strous RD, Schildkraut JJ. Clozapine for comorbid substance use disorder and schizophrenia: do patients with schizophrenia have a reward-deficiency syndrome that can be ameliorated by clozapine? Harv Rev Psychiatry. 1999;6:287–96. doi: 10.3109/10673229909017206. [DOI] [PubMed] [Google Scholar]
- 17.Vardigan JD, Huszar SL, McNaughton CH, Hutson PH, Uslaner JM. MK-801 produces a deficit in sucrose preference that is reversed by clozapine, D-serine, and the metabotropic glutamate 5 receptor positive allosteric modulator CDPPB: relevance to negative symptoms associated with schizophrenia? Pharmacol Biochem Behav. 95:223–9. doi: 10.1016/j.pbb.2010.01.010. [DOI] [PubMed] [Google Scholar]
- 18.Coppola DM, O’Connell RJ. Are pheromones their own reward? Physiology & behavior. 1988;44:811–6. doi: 10.1016/0031-9384(88)90067-4. [DOI] [PubMed] [Google Scholar]
- 19.Smith JC, Sclafani A. Saccharin as a sugar surrogate revisited. Appetite. 2002;38:155–60. doi: 10.1006/appe.2001.0467. [DOI] [PubMed] [Google Scholar]


