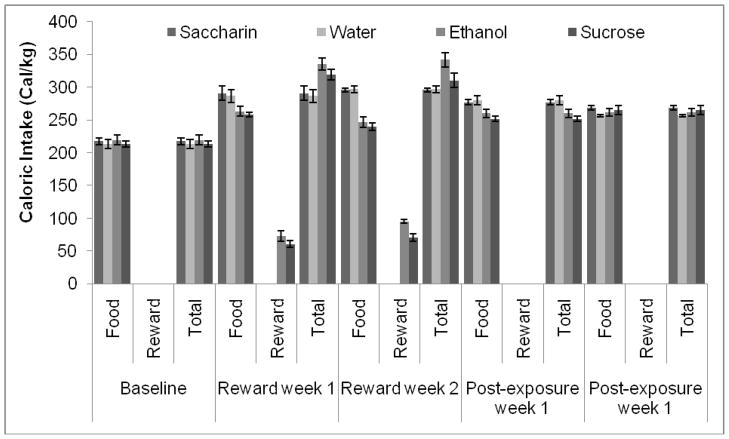
Figure 10.
Total caloric intake before, during, and after exposure to alcohol, sucrose, and saccharin. The alcohol- and sucrose-exposed groups consumed more calories during the first week of exposure to the rewards than the saccharin-exposed and water only groups; the sucrose-exposed group returned to a baseline level of caloric intake by the second week of exposure to the rewards, but the alcohol-exposed group remained elevated compared to the other groups (Mean ± SEM).

