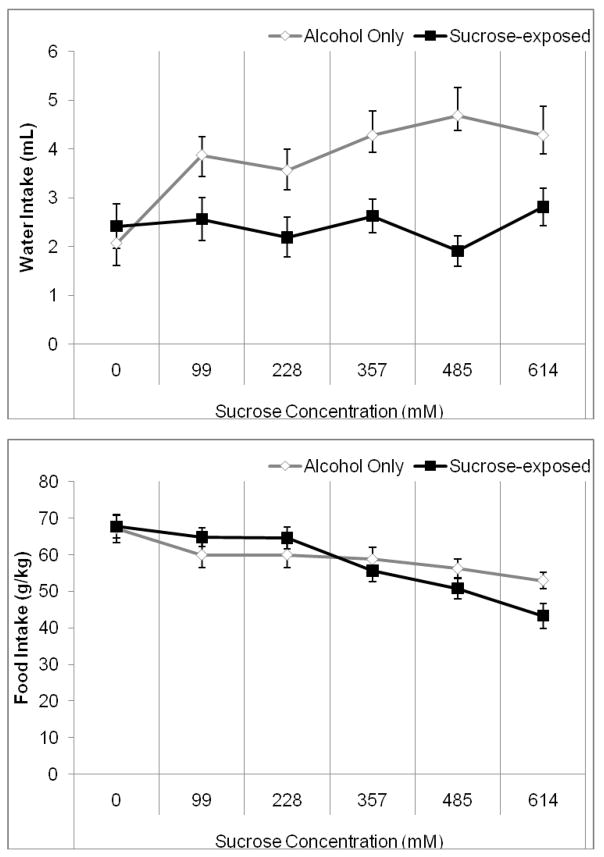
Figure 3.
Water and food intake during exposure to alcohol and sucrose. A) The alcohol control group consumed more water during the latter three concentrations of exposure to sucrose (357–614 mM). B) The group exposed to sucrose ate significantly less during the final two sucrose concentrations (485–614 mM) than it did prior to sucrose exposure, and also ate less than the alcohol control group during the final sucrose concentration (614 mM) (Mean ± SEM).

