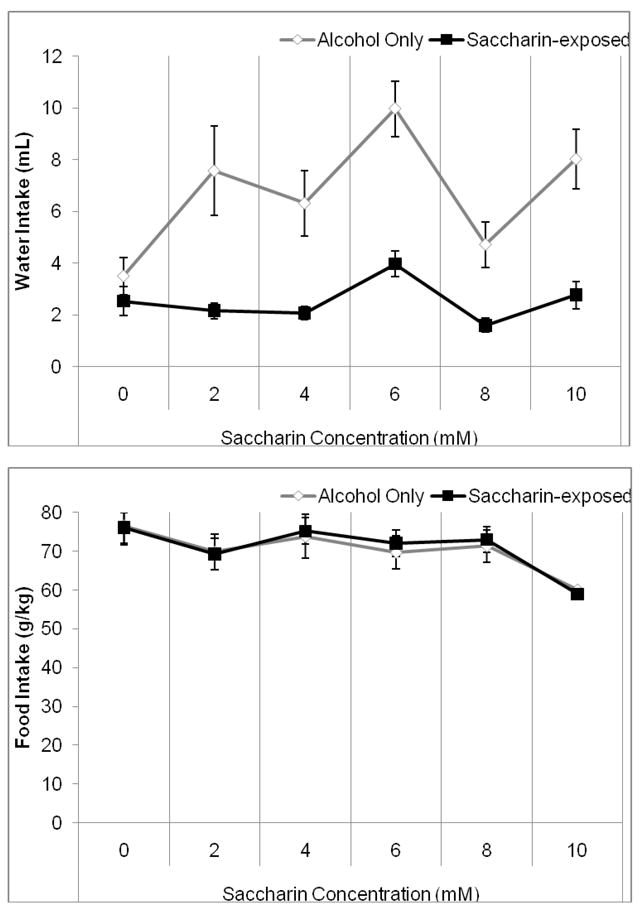
Figure 7.

Water and food intake during exposure to alcohol and saccharin. A) The saccharin-exposed group drank significantly less water than the alcohol control group throughout exposure to saccharin. B) Food intake decreased between the alcohol baseline period and the first saccharin concentration (2 mM) and again between the third and fifth saccharin concentrations (6–10 mM) but there were no differences between groups (Mean ± SEM).
