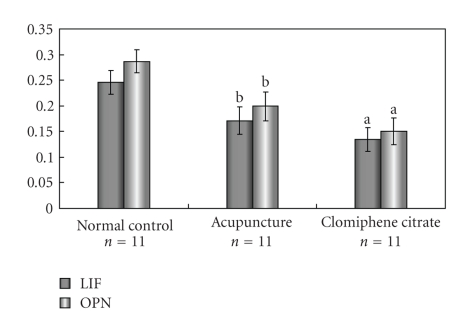
Figure 3.
The immunohistochemical staining intensities of leukaemia-inhibitory factor (LIF) and Osteopontin (OPN) proteins in rat endometria during implantation period. Data are expressed as mean ± SE. (a), P < .01 compared with Normal control group; (b), P < .01 compared with Clomiphene citrate group.

