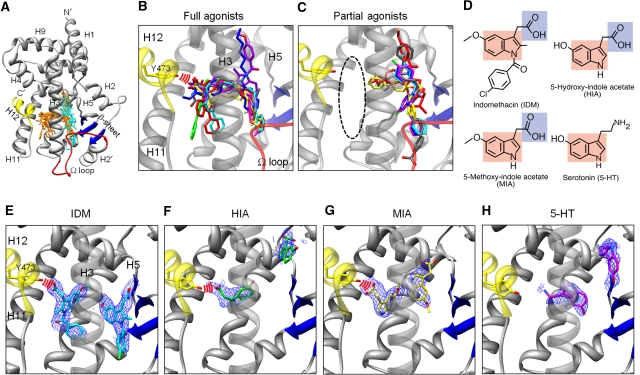
Figure 1.
Configurations of indole acetate-containing ligands and known agonists in the PPARγ LBD. (A) Superposition of known agonists in PPARγ LBDs. Full agonists (orange) and partial ones (cyan) are shown within the apo-LBD (2ZK0; Waku et al, 2009a). The Cα atoms of the LBD are coloured yellow (helix H12), red (Ω loop), blue (β-sheet), and grey (other region). Full agonists are from PDB 2PRG (Nolte et al, 1998); 1FM9 (Gampe et al, 2000); 1I7I (Cronet et al, 2001); 1K74 (Xu et al, 2001); 2ATH (Mahindroo et al, 2005); 2I4J (Pochetti et al, 2007); 2Q59 (Bruning et al, 2007); and 3B3K (Montanari et al, 2008). Partial agonists are from 4PRG: Oberfield et al, 1999); 2Q5P, 2Q5S, 2Q6R, and 2Q61(Bruning et al, 2007); and 3D6D (Montanari et al, 2008). (B) Close-up view of the full agoinsts. Red arcs indicate hydrogen bonds between full agonists and Tyr473. (C) Close-up view of the partial agonists. The area enclosed by the black dashed line is the AF-2 pocket. (D) Chemical structures of IDM, 5-HT, HIA, and MIA. The indole ring and the carboxyl group are coloured red and blue, respectively. (E–H) Crystal structures of the PPARγ LBDs in complex with indole acetate-containing ligands. IDM is coloured cyan (E), HIA is green (F), MIA is yellow (G), and 5-HT is magenta (H), in close-up views with the omit 2Fo-Fc map (contoured at 1σ). The LBD and the hydrogen bonds between each molecule and Tyr473 are represented as described in (A) and (B).

