Figure 4.
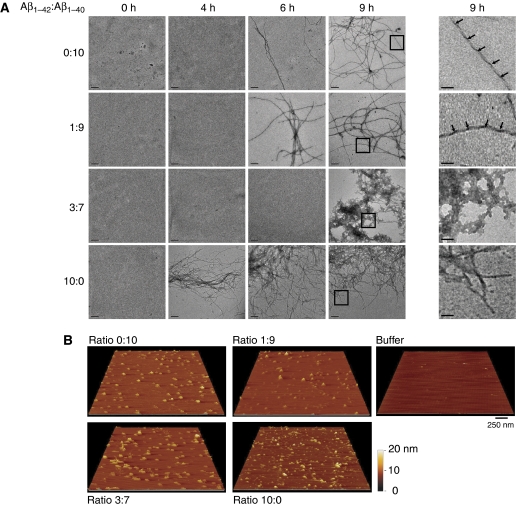
Characterization of Aβ oligomers with transmission electron microscopy and atomic force microscopy. (A) Transmission electron microscopy images of Aβ ratios incubated for 0, 4, 6 and 9 h. Images shown are representative for two experiments. Time of appearance and fibril morphology are affected by Aβ42:Aβ40 ratio and mature fibril formation is delayed for the synaptotoxic 3:7 ratio. The bars represent 0.2 μm size. The last column shows a magnification of the area indicated by squares in the panels of 9 h. The bars represent 0.04 μm size. The arrows indicate a regular twist pattern observed in the 1:9 and 0:10 fibrils. (B) AFM height images of Aβ oligomers formed by incubation of 70 μM Aβ for 1.5 h at 25°C in 50 mM Tris, 1 mM EDTA. The buffer image is shown as a control. The bar represents 250 nm size.

