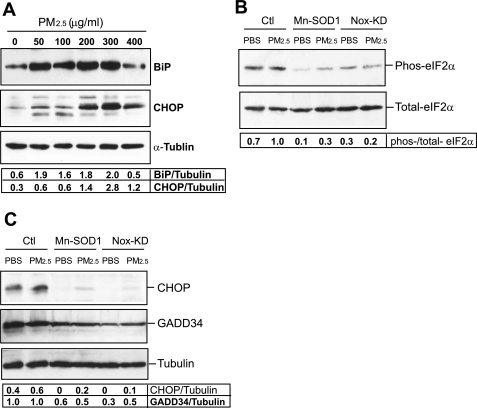
Fig. 5.
PM2.5-induced eIF2α phosphorylation and CHOP induction depends on the production of reactive oxygen species (ROS). A: Western blot analysis of BiP and CHOP expression levels in RAW264.7 cells in response to in vitro exposure to PM2.5 particles at different concentrations ranging from 50 to 400 μg/ml for 6 h. Levels of α-tubulin protein were determined as internal controls. B and C: Western blot analyses for phosphorylated and total eIF2α, CHOP, and GADD34 in RAW264.7 cells under in vitro exposure to PM2.5 or PBS. RAW264.7 cells were infected by adenovirus expressing Mn-SOD1, dominant-negative N17Rac1, or the control vector for 36 h, followed by the incubation with PM2.5 (300 μg/ml) or PBS for 6 h. For A–C, the experiments were repeated at least three times, and the representative data are shown. The values below the gels represent the normalized protein signal intensities.

