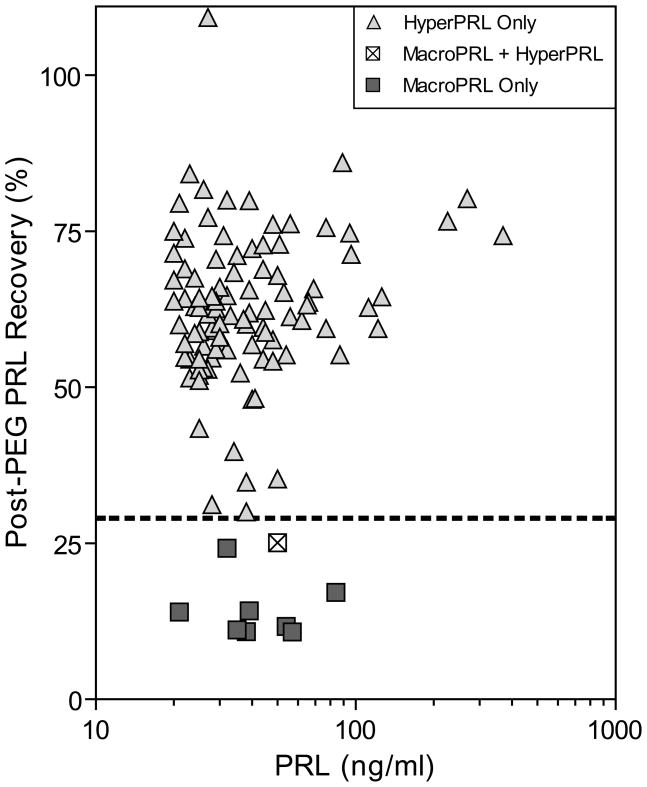
Figure 3.
Scatterplot of PRL concentration vs. PRL recovery after PEG-precipitation. HyperPRL only was defined as a post-PEG recovery >30% and post-PEG PRL concentration >13 ng/mL. MacroPRL and HyperPRL was defined as post-PEG PRL recovery ≤30% at a post-PEG PRL concentration >13 ng/mL. MacroPRL only was defined as a post-PEG recovery ≤30% and post-PEG PRL ≤13 ng/mL. The dotted line indicates the 30% PRL recovery cutoff used to detect macroPRL.

