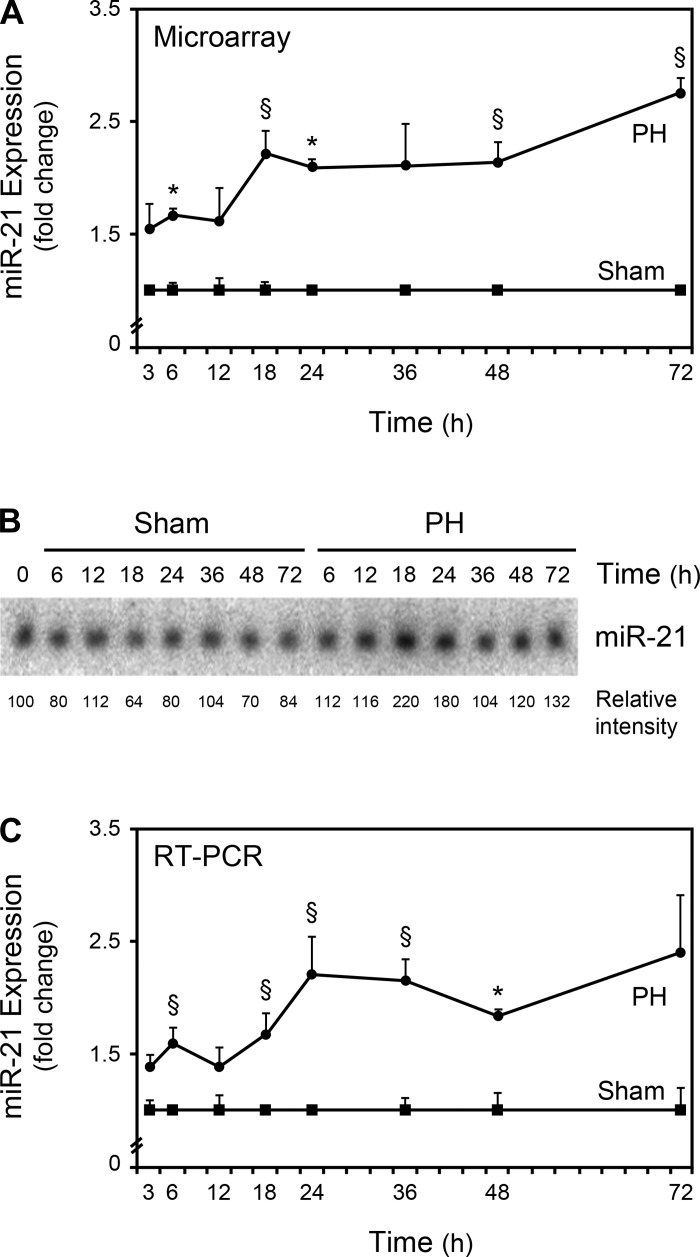
Fig. 3.
miR-21 expression is increased after PH. Expression of miR-21 from 3 to 72 h after PH was evaluated by microarray (A), Northern blot (B), and real-time RT-PCR (C) analyses as described in materials and methods. A representative Northern blot is shown. Results are expressed as mean ± SE fold change for 3 different animals. *P < 0.01 and §P < 0.05 from the corresponding controls.

