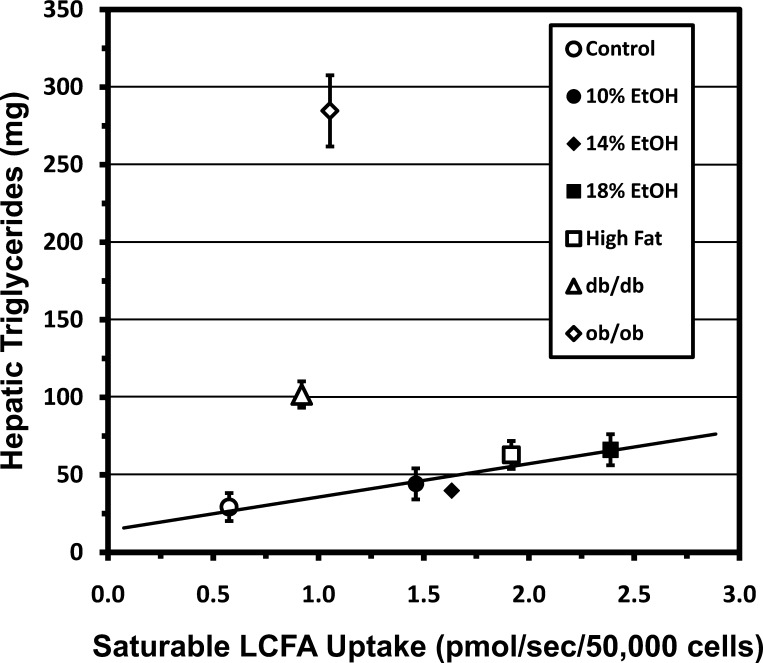
Fig. 4.
Hepatic triglyceride (TG) content plotted as a function of saturable hepatocellular LCFA uptake. Values are group means ± SE. Regression line for groups with functional leptin signaling (control; 10%, 14%, and 18% EtOH; and high fat) indicates that LCFA uptake is highly correlated with hepatic TG content in these groups (R2 = 0.8414, r = 0.92, P < 0.05). Hepatic TG is much greater than predicted by this regression in ob/ob and db/db mice.

