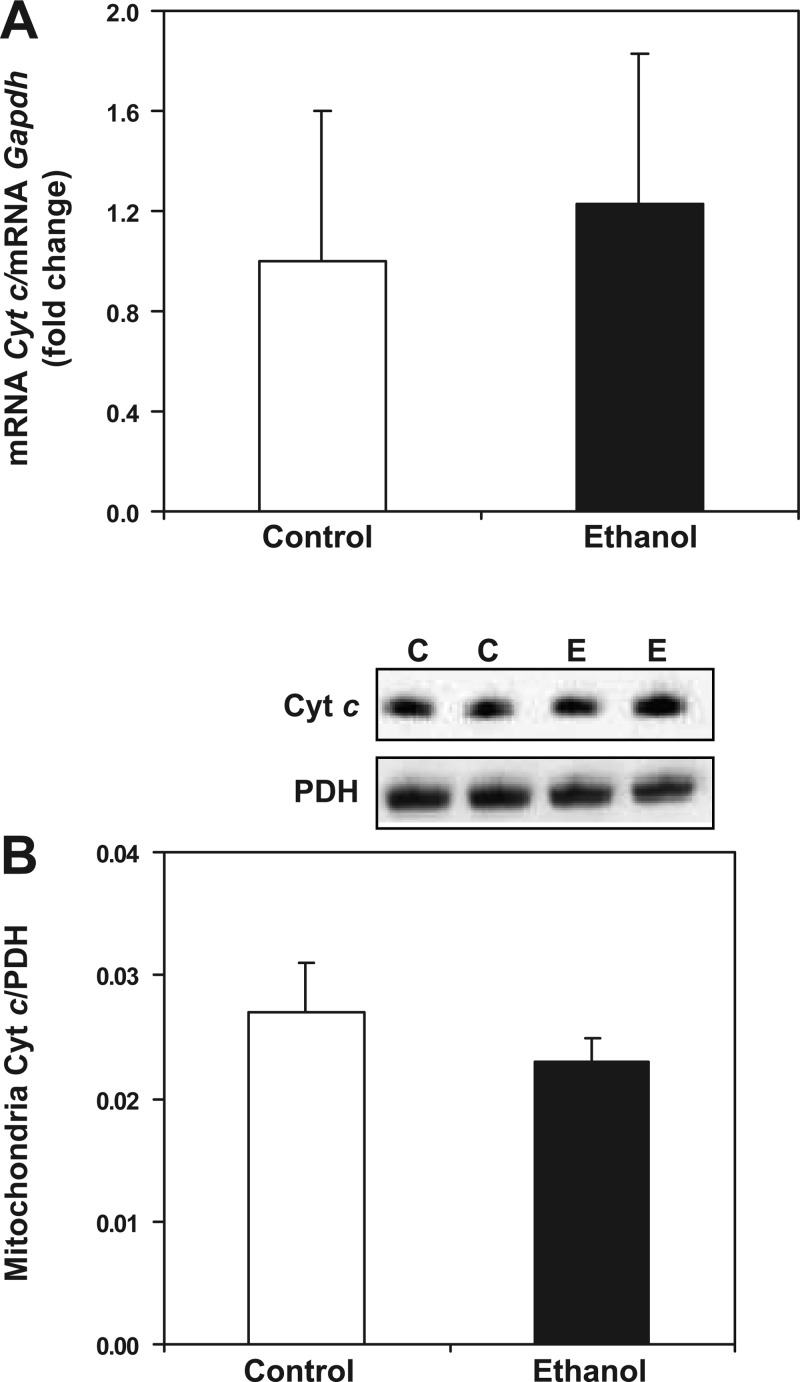
Fig. 5.
Effect of chronic ethanol consumption on cytochrome c (Cyt c) transcript and protein levels. For gene expression analyses, total RNA was isolated and measured by real-time PCR. The relative amount of mRNA was determined using the comparative threshold (Ct) method by normalizing target cDNA levels to Gapdh. Protein was measured by Western blotting technique and normalized to pyruvate dehydrogenase (PDH). A: there was no difference in Cyt c gene expression between control- (C) and ethanol-fed (E) animals. B: there was no difference in mitochondrial Cyt c protein between control and ethanol groups. Data are expressed as the mean ± SE for 6 pairs of control- and ethanol-fed rats.

