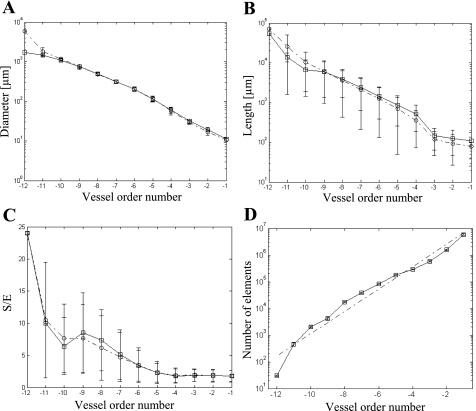
Fig. 3.
Comparisons of the data (39) (○) with the reconstruction (□) in terms of vessel order distribution: element diameter (A), element length (B), segment-to-element ratio (S/E; C), and element number (mean and SD; D) together with the corresponding linear regression curve (dashed-dotted line).

