Fig. 5.
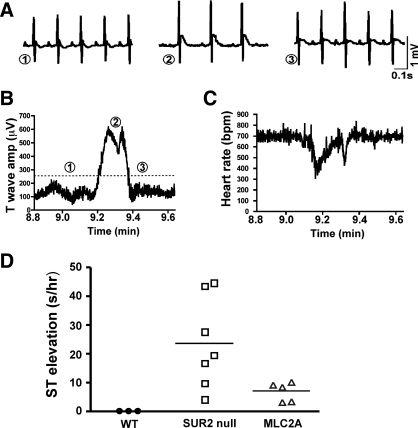
ST segment elevation episodes are reduced in frequency in MLC2A compared with SUR2 null mice. Conscious telemetric ECG recording was conducted on SUR2 null (n = 9) and MLC2A (n = 5) cohorts for 48-h intervals. A: examples of ST segment elevation are shown from an episode lasting ∼1 min. A baseline tracing just before an ST segment episode is shown in 1. This was followed by an ST segment episode shown in 2. Recovery following the ST segment elevation is shown in 3. B: T-wave amplitude was plotted as an indicator of ST segment elevation over the time frame that includes the data shown in A, where 1, 2, and 3 correlate with those same time points in A. The T-wave amplitude is increased at point 2, reflecting ST segment elevation. C: heart rate [in beats/min (bpm)] was plotted for the same time window as in A and B, showing that heart rate declines during ST segment elevation, as we previously noted (5). D: we used an algorithm to measure T-wave amplitude and found that that MLC2A rescued mice had significantly less ST segment elevation than SUR2 null mice, reflecting a reduction in frequency and duration of episodes. The observed reduction of coronary vasospasm in MLC2A mice was significant (P < 0.05).

