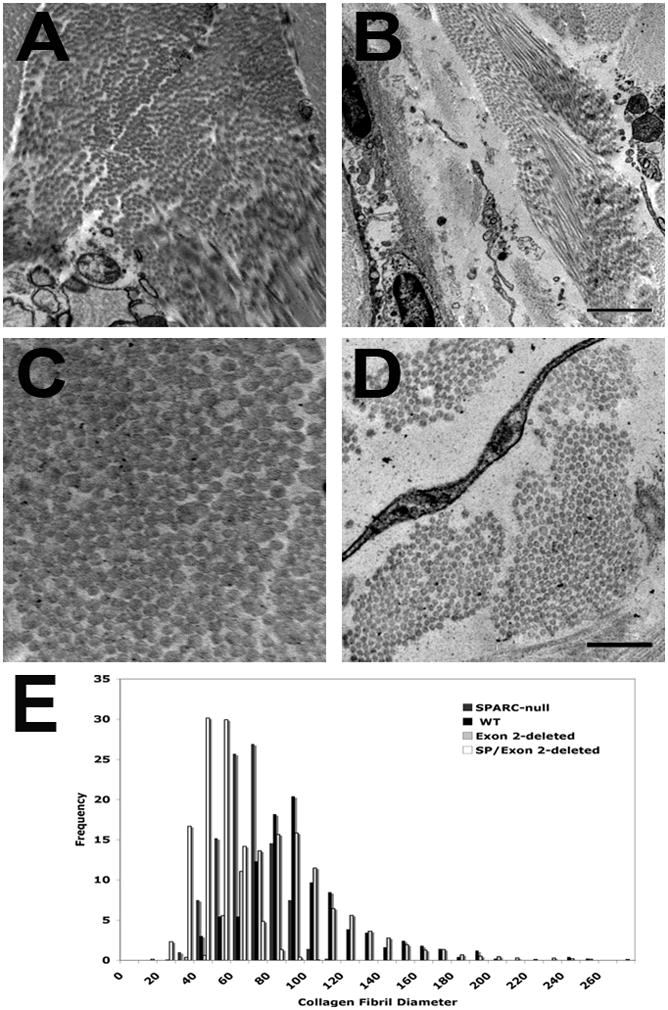
Figure 4.

Representative EM images from Exon 2-deleted (A and C) and SPARC-null/Exon 2-deleted dermal sections. Bar in B equals 2 μm for panels A and B. Bar in D equals 500 nm for panels C and D. E) Collagen fibril diameter distribution for the four genotypes. WT (black bars), Exon 2-deleted (light gray bars), SPARC-null (dark gray bars), SPARC-null/exon 2-deleted (double deleted, white bars).
