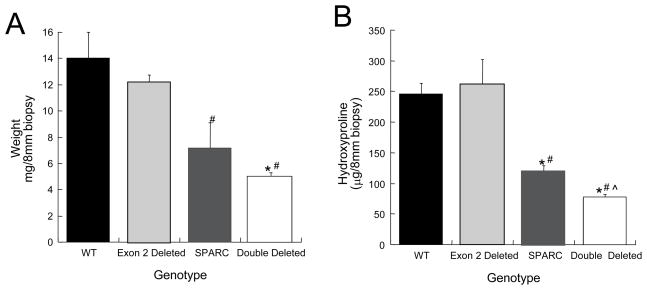
Figure 5.
A) Dry weight of skin biopsies and B) hydroxyproline analysis of 8 mm punch biopsies. Four animals per genotype and 2 biopsies per animal contributed to the analysis. WT (black bars), Exon 2-deleted (light gray bars), SPARC-null (dark gray bars), SPARC-null/exon 2-deleted (double deleted, white bars). Error bars represent standard error of the mean. # p<0.05 versus WT, * p<0.05 versus Exon 2-deleted, ^ p<0.05 versus SPARC-null.

