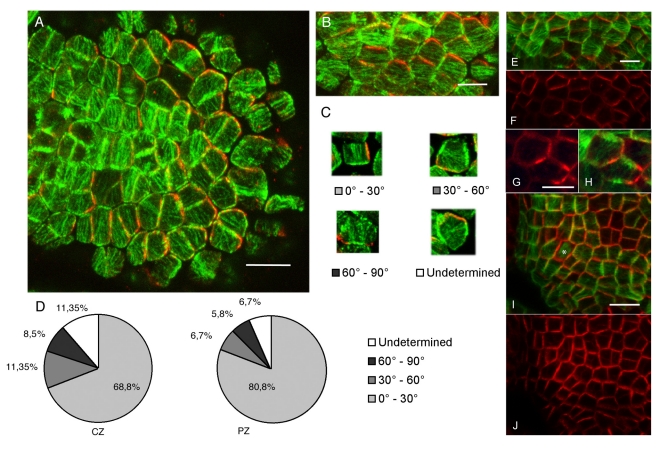
Figure 1. Microtubule and PIN1 orientations are correlated.
(A) Immunolocalization of PIN1 (red) and α-tubulin (green) in a thick section through the surface of the meristem. Scale bar: 10 µm. (B) Close-up of the double PIN1–microtubule immunosignal in the boundary domain: PIN1 (red) and microtubule (green) patterns are correlated. Scale bar: 5 µm. (C) Examples of different degrees of correlation between microtubule bundle orientation and PIN1 localization, as quantified in (D). (D) Quantifications of the different classes of behavior in the center zone (CZ) and peripheral zone (PZ) of the meristem (n = 614 cells). (E–J) Correlations between PIN1 polarities and microtubule orientations similar to those seen in (B) are observed in living plants expressing PIN1-GFP (red) and TagRFP-MAP4 (green) in the boundary domain (E–H) and in incipient primordia (asterisk) (I and J). Scale bars for (E), (G), and (I): 5 µm.

