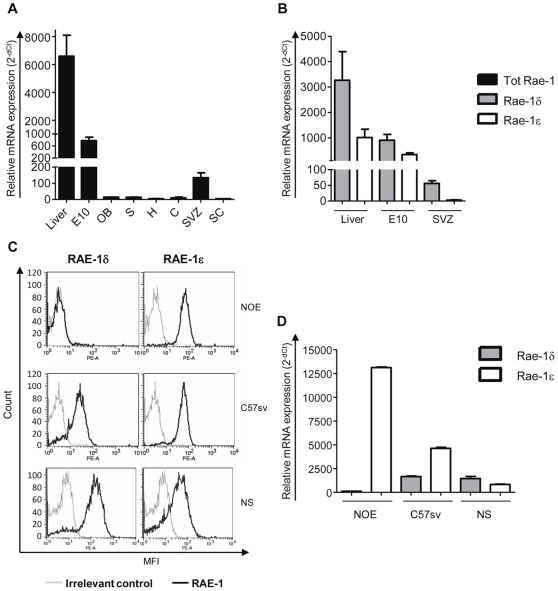
Figure 2. Expression of Rae-1 transcripts in C57BL/6 tissues and cell lines.
A and B, Quantification of all Rae-1, Rae-1δ and Rae-1ε transcripts in healthy tissues: 10-days-old embryo (E10), liver and different parts of the adult central nervous system: olfactory bulbs (OB), subventricular zone (SVZ), spinal cord (SC), striatum (S), cerebellum (C) and hippocampus (H). Results were expressed as mean of 3 analyses +/− SEM relatively to GAPDH as endogenous control. C, Expression of RAE-1δ and RAE-1ε proteins analyzed on NOE and C57sv cell lines and neurosphere cells by flow cytometry after staining with anti-RAE-1δ or -RAE-1ε antibodies and PE-labeled anti-rat immunoglobulins. D, Expression of Rae-1δ and Rae-1ε transcripts by NOE and C57sv cell lines and neurosphere cells, quantified by qPCR.

