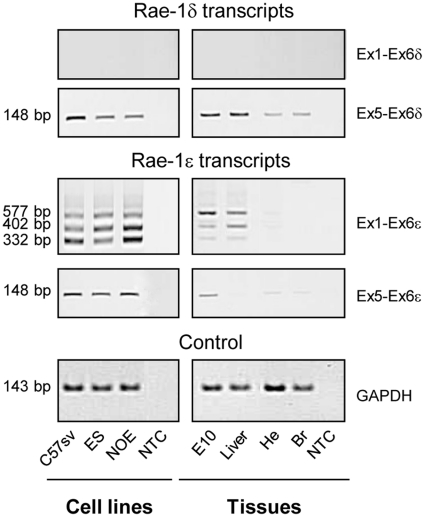
Figure 4. Characterization of Rae-1δ and Rae-1ε transcripts.
A, RT-PCR analysis of Rae-1δ transcripts using an exon 1-exon 6δ primer pair or an exon 5-exon 6δ primer pair and of Rae-1ε transcripts using an exon 1-exon 6ε primer pair or an exon 5-exon 6ε primer pair (see schematic in Fig. 6). We compared the PCR products obtained from cell lines (C57sv, ES, NOE) and healthy tissues (10-days-old embryo (E10), liver, heart (He) and brain (Br)); NTC, non template control.

