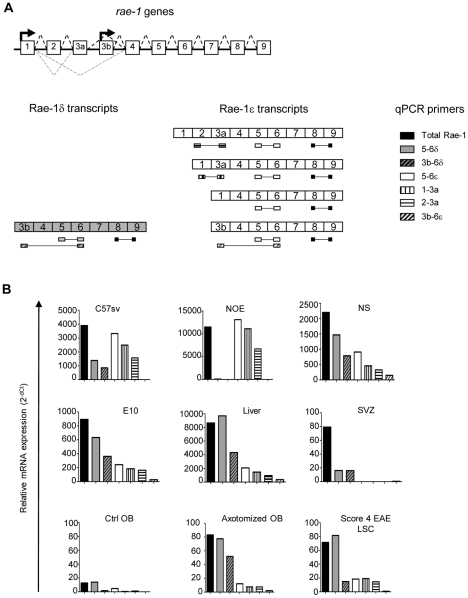
Figure 6. Quantification of all Rae-1 transcripts in vivo and in vitro.
A, Schematic representation of rae-1 genes with exons (boxes), transcription start sites (bold arrows), intron splicing (bold doted lines) and alternative splicing (thin doted lines). Prediction of all Rae-1δ and Rae-1ε transcripts under the control of either promoter 1 or promoter 2 and position of sets of primers allowing the detection and quantification of each transcript. B, RT-qPCR of each transcript in 10-days-old embryo (E10), subventricular zone (SVZ), liver, olfactory bulbs (OB) from control or axotomized mice, lumbar spinal cord (LSC) from mice suffering EAE and neurospheres (NS), C57sv and NOE cell lines. Results are expressed relatively to GAPDH as endogenous control.

