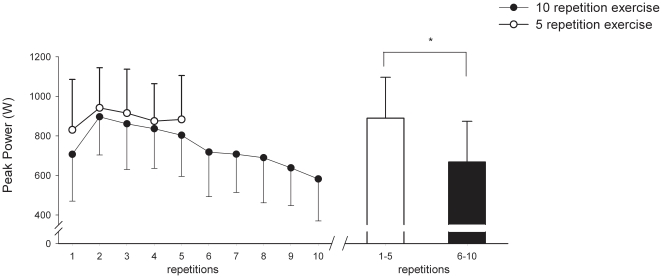
Figure 1. Peak power output profiles (average for n = 6 subjects) for each exercise during the two experimental conditions: when exercise was 5 repetitions (open circles) and when exercise was 10 repetitions (filled circles).
Boxes represent mean of the peak power output for the first and the second half of a set of 10 repetitions. *significant difference (P<0.01) between the first and the second 5 repetitions. Values are means ± SD.

