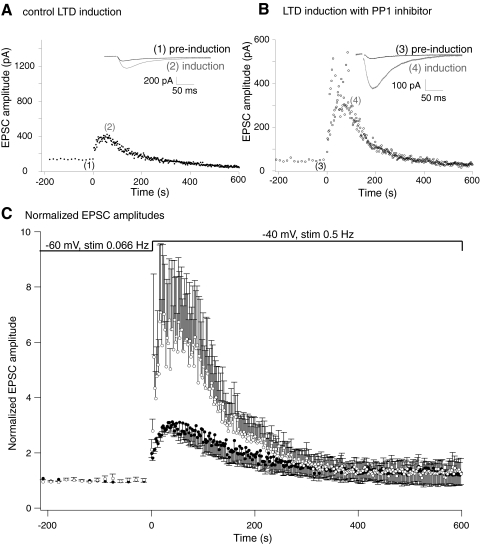
Fig. 3.
Short-term plasticity of NMDA receptor-mediated EPSCs during LTD induction. Pharmacologically isolated NMDA receptor-mediated EPSCs were recorded before and during the LTD induction protocol. A: graph of NMDA EPSC amplitude. Responses were recorded at 15 s intervals at –60 mV prior to the induction protocol. The membrane potential was then stepped to –40 mV and responses recorded at 2 s intervals. Inset: traces are example EPSCs from the preinduction recording (1, at –60 mV) and at the peak of the EPSC amplitude during the induction protocol (2, at –40 mV). B: neuron recorded under the same conditions as (A) but the PP1 inhibitor peptide was included in the whole cell patch solution. Note that in A and B, the initial amplitude of the EPSC was not the same (this varied from 50 to 120 pA across all recordings). Therefore the graph y axes are adjusted to give approximately comparative initial scaling. C: normalized recordings from 5 cells under control conditions (●) and 5 cells in which the PP1 inhibitor peptide was included in the whole cell patch solution (○). EPSC amplitudes were normalized to preinduction amplitudes during stimulation at –60 mV. Inhibition of PP1 significantly enhances the short-term potentiation of the NMDA receptor-mediated EPSC.

