Fig. 1.
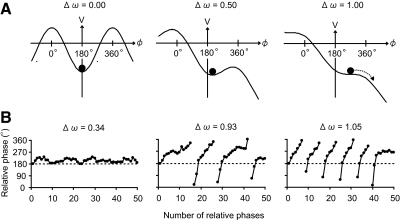
Schematic diagrams of evolving potential functions and time series of ϕ obtained by simulating Eq. 3. A: potential function. The symmetry in the potential function is broken by increasing the symmetry-breaking parameter from Δω = 0.0 to 0.5, and 1.0 (see left, middle, and right panels). The remaining parameters of the potential function were considered equal to a = 1, b = 0, c = 2, and ψ = 180°. The local minimum of the potential function, indicated by the filled circles, deviates gradually from ϕ = 180° and, finally, phase wandering is observed (see dotted arrow). B: typical examples of simulated time series. The number of phase wanderings (line breaks) increases as the symmetry-breaking parameter increases from Δω = 0.34 to 0.93, and 1.05 (see left, middle, and right panels). The remaining parameters were considered equal to a = 1, b = 0, c = 2, ψ = 180°, and Q = 20°.

