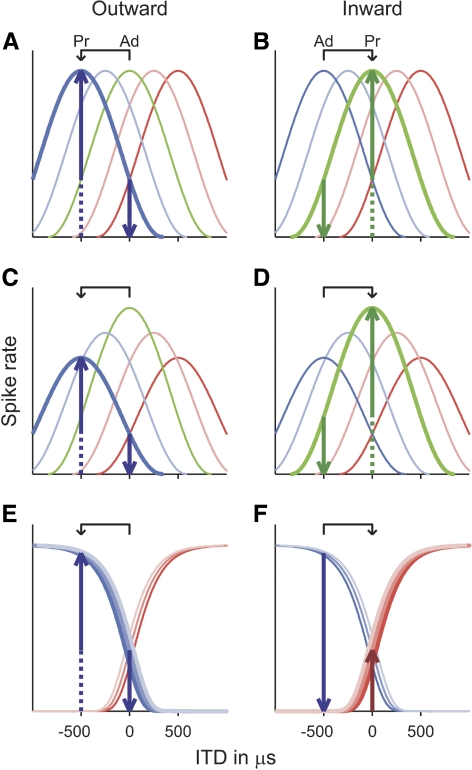
Fig. 1.
Schematic representation of neural interaural time difference (ITD) tuning curves in the topographic (A to D) and opponent-channel (E and F) models. The topographic model is shown either with equal numbers of neurons at all best ITDs (A and B) or with more neurons tuned to ITDs near zero than to large ITDs (represented by the heights of the tuning curves in C and D). The solid upward-pointing arrows show the predicted size of the transition response to an ITD change away from (“outward”; left panels) or toward (“inward”; right panels) the midline (between 0 and −500 μs in this example; see arrows above panels). The predictions are based on the assumptions that 1) only neurons responding more strongly to the probe than to the adaptor contribute to the transition response (indicated by bold tuning curves) and 2) the size of the transition response reflects the differential between the probe and adaptor responses of these neurons (upward- and downward-pointing arrows, respectively). Ad: ITD of the adapting sound; Pr: ITD of the probe sound.

