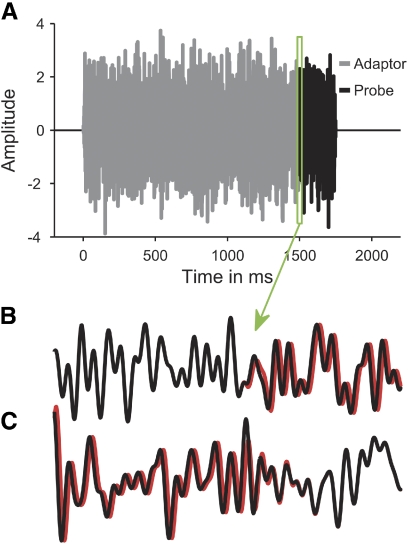
Fig. 2.
Temporal waveform of an example stimulus (A). The gray and black lines show the adaptor and probe portions of the stimulus, respectively. B and C: the left- (black) and right-ear (red) waveforms of an outward (B) and inward (C) ITD change between 0 and −250 μs in a highly magnified section around the transition from the adaptor to the probe (green rectangle in A).

