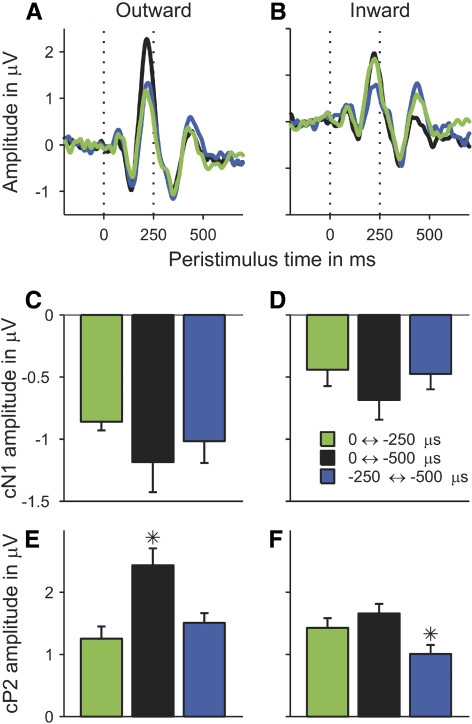
Fig. 5.
Grand-average vertex (Cz) responses to the individual outward (A) and inward (B) ITD change conditions, plotted as a function of time relative to the probe onset. Different conditions are marked by different colors (see legend in D). C–F: the peak amplitudes of the cN1 (C and D) and cP2 deflections (E and F) in these responses. Error bars show the SE. Stars mark significant differences between the different ITD change conditions.

