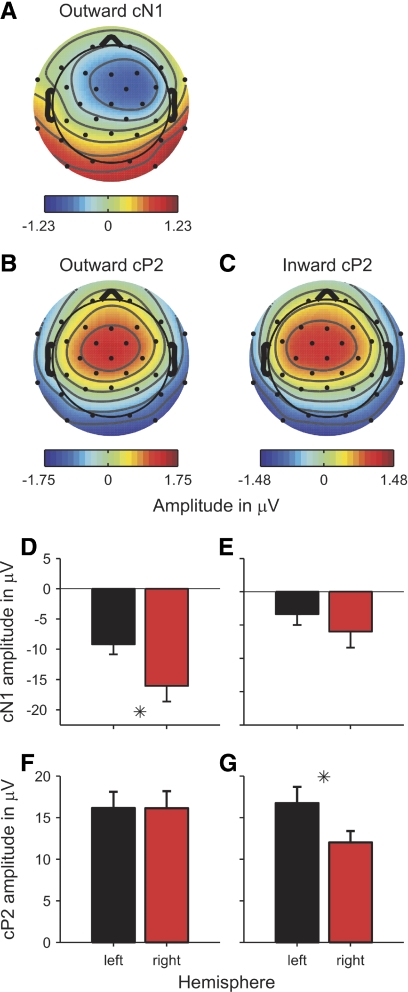
Fig. 6.
Grand-average scalp distribution maps (A–C) and source amplitudes (D–G) of the average outward (left panels) and inward ITD change responses (right panels). The scalp maps were averaged over the 40-ms time windows around the vertex peaks of the cN1 (A) and cP2 deflections (B, C). The cN1 deflection of the average inward response was too small to yield a meaningful map. D–G: black and red bars show the source amplitudes of the left- and right-hemisphere dipoles, respectively. D and E: the source amplitudes of the cN1 deflection. F and G: the cP2 source amplitudes. Error bars show the SE. Stars mark significant differences between the left- and right-hemisphere source amplitudes.

