Figure 3.
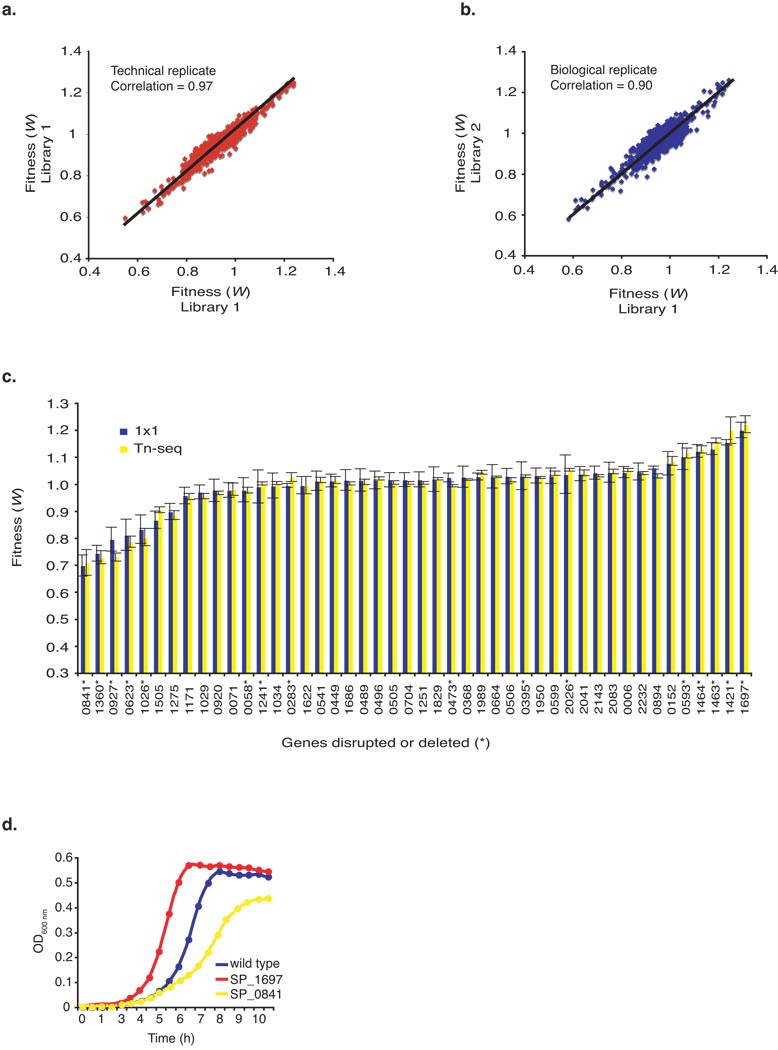
Validation of Tn-seq fitness measurements. (a) A technical replicate of the same library comparing the effect of sample preparation and sequencing. Pearson correlation coefficient = 0.97. (b) A biological replicate comparing two independently generated, selected upon and sequenced libraries. Pearson correlation coefficients between biological replicates ranged between 0.70 – 0.90. A representative example is shown. (c) Comparison of fitness (± s.e.m.) obtained with Tn-seq (yellow) and the classical 1×1 competition method (blue) for 30 random transposon insertions and 16 marked gene deletions (*). Numbers underneath the graph refer to Streptococcus pneumoniae TIGR4 gene numbers (SP_number). (d) Three representative growth curves; the wild type strain, a strain with an advantageous deletion (SP_1697, W=1.22) and a strain with a disadvantageous deletion (SP_0841, W=0.71).

