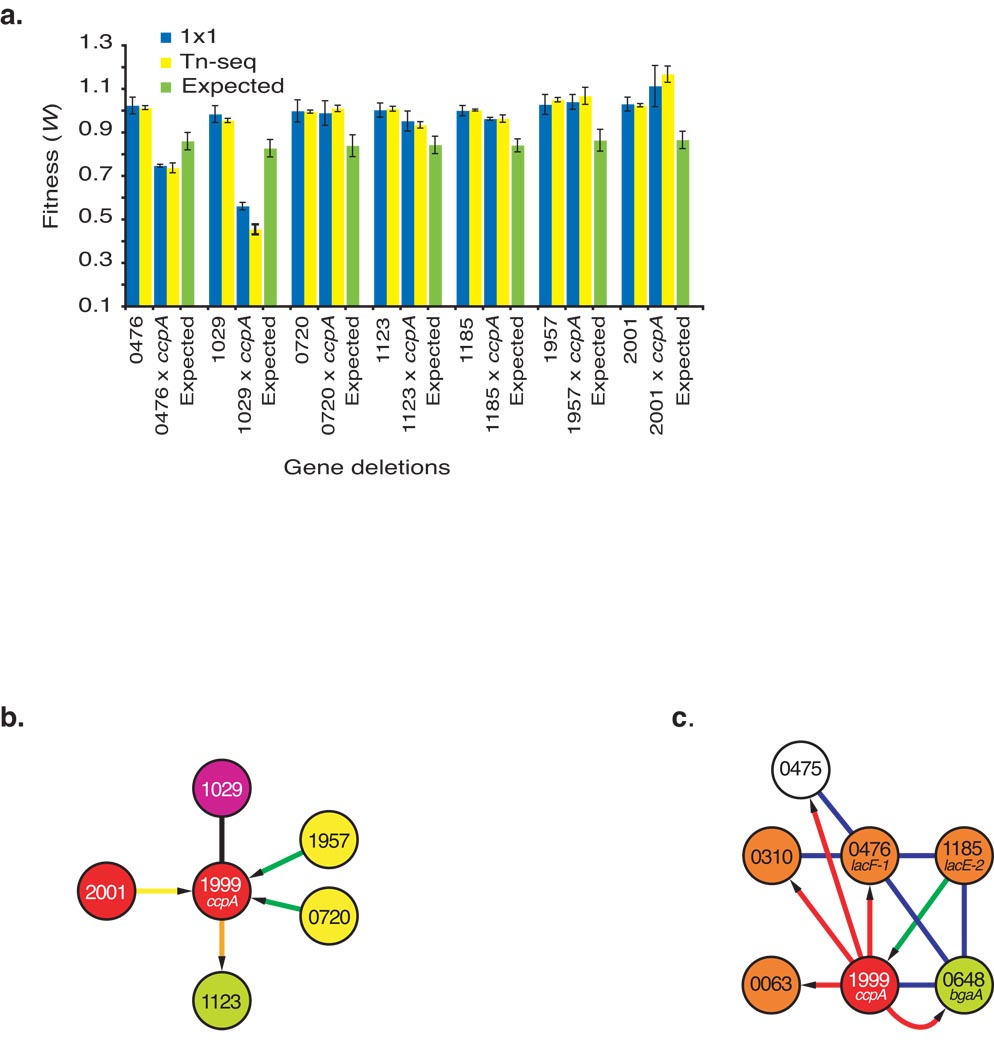
Figure 5.
Validation of genetic interactions. (a) Fitness (± s.e.m.) of seven genes either knocked out singly or in combination with ccpA are compared between the 1×1 method (blue) and Tn-seq (yellow). The expected multiplicative fitness for each double gene knockout is depicted in green (expected fitness was determined by multiplying ccpA fitness [0.84±0.04 s.e.m.] with fitness measured for the other gene). Numbers underneath the graph refer to Streptococcus pneumoniae TIGR4 gene numbers (SP_number). (b) A detail of the genetic interaction network showing five of the validated genetic interactions and their specific interactions. (c) A sub-network from the larger genetic interaction network showing four PTS genes including two of the validated genetic interactions (SP_0476 and SP_1185), β-galactosidase (SP_0648) and a gene with unknown function (SP_0475). Interaction colors, node colors and numbers are as in Figure 4.

