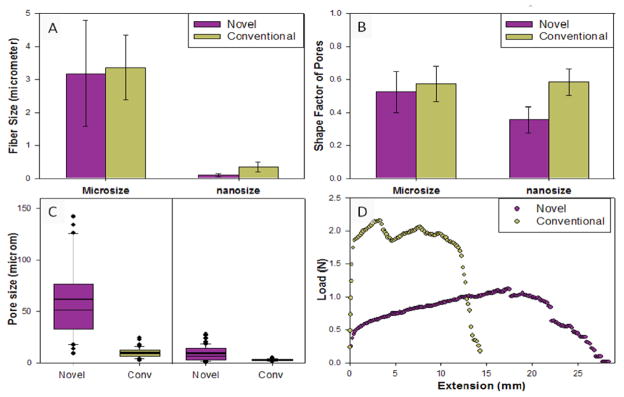
Figure 4. Comparison of fibrous layer characteristics.
(A) Fiber diameters and the error bars correspond to the standard deviation (n = 50). (B) Shape factor and the error bars correspond to the standard deviation (n = 50). (C) Box plot showing the distribution of pore size with 10th, 25th, 50th, 75th, and 90th percentiles and the mean value (thick line within each box). Values that were outside 95th and 5th percentiles were treated as outliers. (D) The load–extension behavior.

