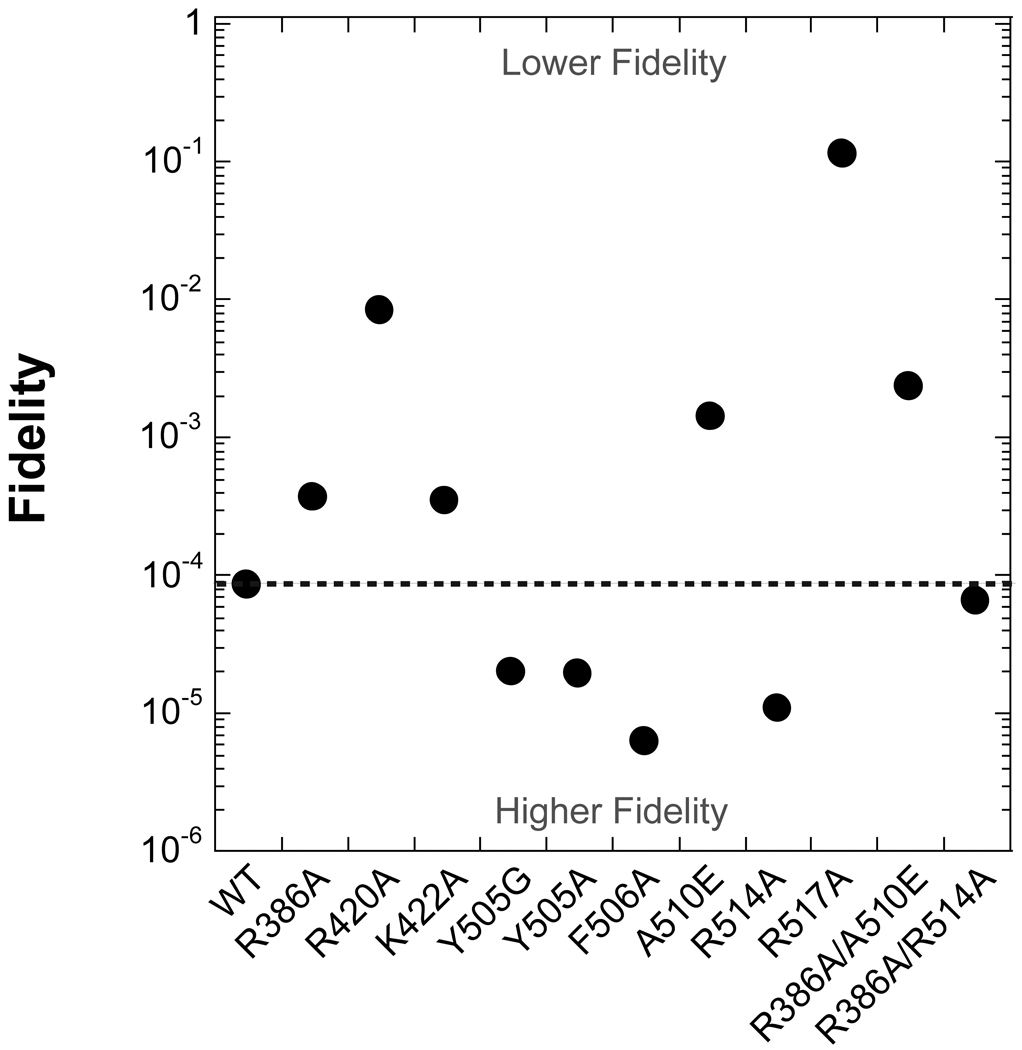
Figure 4.
Fidelity of mutant enzymes versus WT. The base substitution fidelity calculated in Table 3 is plotted for each enzyme. The dashed line coincides with the fidelity of WT Pol λ. Thus, mutants with a calculated fidelity value above the dashed line exhibit lower polymerase fidelity than WT Pol λ.

