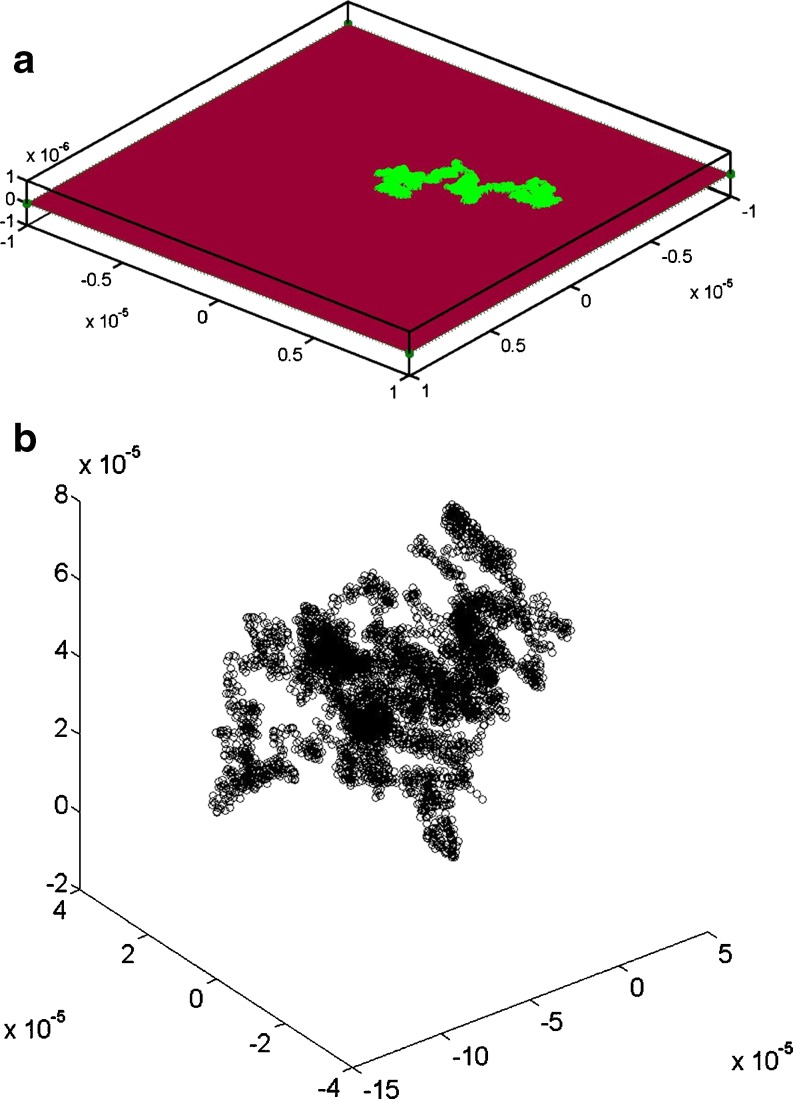
Fig. 3.
Single particle trajectories for tracer diffusion in simple (a) 2D (Di = 5.4 μm2 s-1) and (b) 3D continuum fluids  . Ri = 1 nm, Hi = 5 nm,
  ,
,  , T = 37°C, total simulation time was 1 s. Particles were initially located at the central position. Particle trajectories were simulated using time steps of 25 μs

