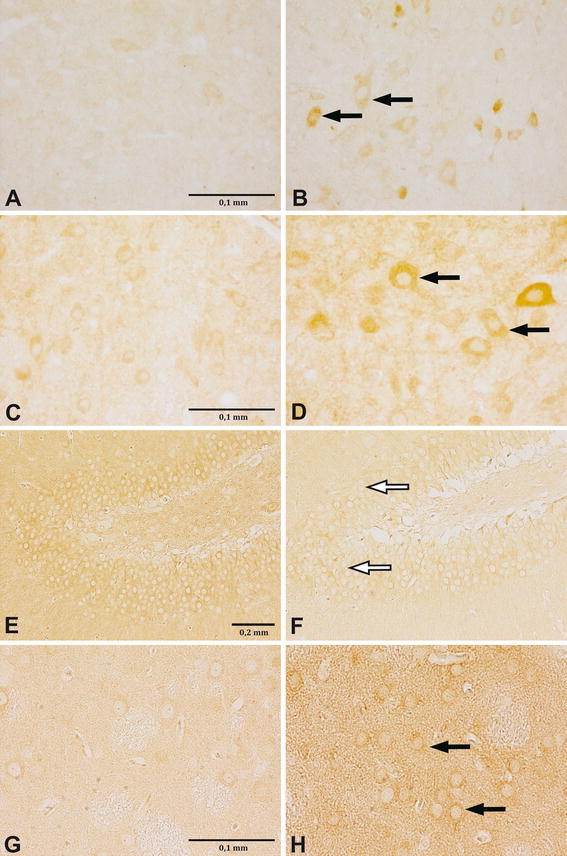
Fig. 1.

Changes in MOR density in different brain structures of neonatally THIM-treated rats. Images are representative photographs of MOR reaction, visualized as brown/dark rings around cells (pointed with arrows). THIM administration led to increase of MOR density in the PAG (a–d) and the CPU (g–h) (increase pointed with black arrows), but to decrease of MOR density in the DG (e–f) (decrease pointed with white arrows). a DMPAG, control, 8-week, ×400; b DMPAG, 240 μg Hg/kg, 8-week, ×400; c DMPAG, control, 20-week, ×400; d DMPAG, 3,000 μg Hg/kg, 20-week, ×400; e DG, control, 20-week, ×100; f DG, 3,000 μg Hg/kg, 20-week, ×100; g CPU, Control, 20-week, ×400; h CPU, 3,000 μg Hg/kg, 20-week, ×400. For interpretation of the references to color in this figure legend, the reader is referred to the online version of this article
