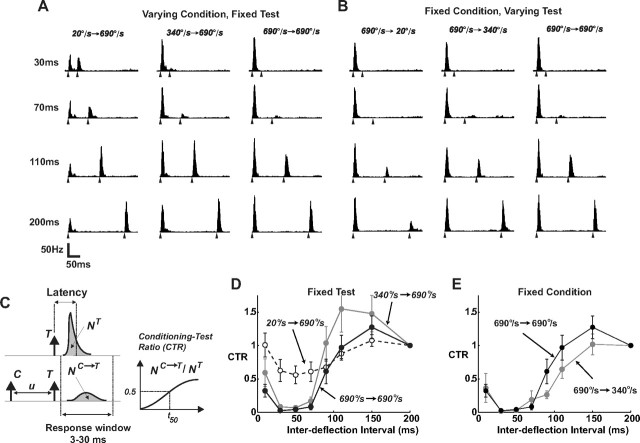
Figure 2.
Responses of SI neurons systematically vary with stimulus history. A, Average PSTHs for paired-pulse deflection stimuli (n =19 neurons; bin size of 2 ms). The velocity of the second (test) stimulus was held constant, and the angular velocity of the first (conditioning) stimulus was varied, over a range of IDIs. The IDI for each case is noted on the left, and the filled triangles under each PSTH indicate the times of the paired deflections. B, Average PSTHs when the velocity of the first (conditioning) stimulus was held constant, and the angular velocity of the second (test) stimulus was varied. The same conventions are used as in A. C, The CTR was computed for a range of IDIs by computing the spike count response to the test (T) stimulus in presence of a preceding conditioning (C) deflection (NC→T), and normalizing this quantity by the response measured when T is presented in isolation (NT). Spike count is computed as the area under the measured PSTHs over the 3–30 ms poststimulus time window. D, Dependence of poststimulus suppression on the velocity of the conditioning stimulus, showing the average CTR curves obtained for a fixed test stimulus of 690°/s, and three different conditioning stimuli (20°/s: dashed, 340°/s: gray, and 690°/s: black). Error bars represent ±1 SEM, where averaging was over the sample of n = 19 cells, a subset of the total for the velocity tuning measurements in Figure 1. E, Dependence of poststimulus suppression on the velocity of the test stimulus, showing the average CTR curves obtained for a fixed conditioning stimulus of 690°/s, and test stimuli (340°/s: gray, and 690°/s: black). Note that the test stimulus of 20°/s produced a significant amount of variability in the response from neuron to neuron, precluding an accurate characterization of the CTR for this test velocity.

